Exam 15: Nonparametric Statistics
Exam 1: Describing Data With Graphs94 Questions
Exam 2: Describing Data With Numerical Measures186 Questions
Exam 3: Describing Bivariate Data35 Questions
Exam 4: Probability and Probability Distributions136 Questions
Exam 5: Several Useful Discrete Distributions129 Questions
Exam 6: The Normal Probability Distribution196 Questions
Exam 7: Sampling Distributions162 Questions
Exam 8: Large-Sample Estimation173 Questions
Exam 9: Large-Sample Tests of Hypotheses210 Questions
Exam 10: Inference From Small Samples261 Questions
Exam 11: The Analysis of Variance156 Questions
Exam 12: Linear Regression and Correlation165 Questions
Exam 13: Multiple Regression Analysis178 Questions
Exam 14: Analysis of Categorical Data136 Questions
Exam 15: Nonparametric Statistics198 Questions
Select questions type
A two-independent sample t-test corresponds to a Wilcoxon signed rank test for paired samples.
Free
(True/False)
4.8/5  (35)
(35)
Correct Answer: Verified
False
If the Friedman test is applied to a data set that are generated from a randomized block experiment with 5 treatments and 7 blocks, then the rejection region at the 5% significance level is  .
.
Free
(True/False)
4.8/5 (31)
Correct Answer:Verified
False
In an investigation of the visual scanning behavior of deaf children, measurements of eye movement rates were taken on nine deaf and nine hearing children as shown in the table below. 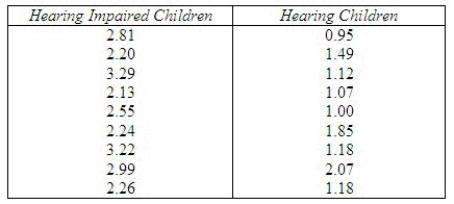 Does it appear that the distributions of eye-movement rates for deaf children and hearing children differ? Test at
  = 0.05 using the Wilcoxon rank sum test.
The null and alternate hypotheses are:
= 0.05 using the Wilcoxon rank sum test.
The null and alternate hypotheses are:  : The distributions of eye-movement rates for hearing impaired children and hearing children are identical.
  : The distributions of eye-movement rates for hearing impaired children and hearing children are different.
What is the test statistic?
T: ______________
What is the critical value for the test statistic?
______________
Thus: ______________
Conclude:
We conclude that the hearing impaired children ______________ from the hearing children in eye-movement rate.
: The distributions of eye-movement rates for hearing impaired children and hearing children are different.
What is the test statistic?
T: ______________
What is the critical value for the test statistic?
______________
Thus: ______________
Conclude:
We conclude that the hearing impaired children ______________ from the hearing children in eye-movement rate.
Free
(Short Answer)
4.7/5 (35)
Correct Answer:Verified
45; 62; Reject the null hypothesis; differ
Nonparametric tests are methods of inference that make no assumptions whatsoever about the nature of underlying population distributions or their parameters.
(True/False)
4.7/5 (29)
Two aptitude tests are currently being used to screen applicants for a certain position within a company. The question arose as to whether the two tests are comparable, i.e., whether they yield the same results. Six applicants were selected at random to take both tests (in a random order). The following scores were recorded: 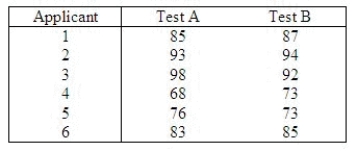 Use the Wilcoxon signed-rank test to determine whether there is a difference in scores between the two tests. Use
  = 0.10.
What is the test statistic?
______________
What is the critical value for the test statistic?
______________
Conclude:
______________
We ______________ conclude there is a difference in the frequency distributions of scores for the two aptitude tests.
= 0.10.
What is the test statistic?
______________
What is the critical value for the test statistic?
______________
Conclude:
______________
We ______________ conclude there is a difference in the frequency distributions of scores for the two aptitude tests.
(Short Answer)
4.7/5 (34)
The nonparametric counterpart of the parametric t-test of  for matched pairs is the:
(Multiple Choice)
4.8/5 (32)
You are performing the Wilcoxon rank-sum test. The 14th through 16th values in an ordered array of pooled sample data all equal $160 (while the 13th value is less and the 17th value is more). The appropriate ranks for the three $160 values are:
(Multiple Choice)
4.8/5 (36)
A car dealer was interested in comparing two brands of tires to see if they yielded different wear length (in thousands of miles). The dealer selected eight cars at random and used each of the brands of tires on each car. The wear length was recorded as follows: 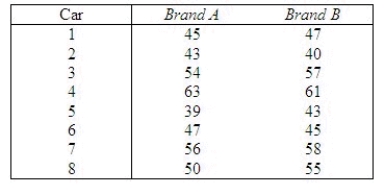 Use the sign test to see if the distribution of wear length is the same for both brands of tires. Use
  = 0.05.
The null and alternate hypotheses are:
= 0.05.
The null and alternate hypotheses are:  : The distributions of wear length are identical for the two brands of tires, and p = 0.50.
  : The distributions of wear length are not identical for the two brands of tires, and p
  0.50.
What is the test statistic?
x = ______________
What is the p-value for the test statistic?
______________
Conclusion ______________
Conclude that the distributions of wear length for the two brands of tires are ______________.
0.50.
What is the test statistic?
x = ______________
What is the p-value for the test statistic?
______________
Conclusion ______________
Conclude that the distributions of wear length for the two brands of tires are ______________.
(Short Answer)
4.9/5 (31)
If the Friedman test is applied to a data set that are generated from a randomized block experiment with 3 treatments and 5 blocks, then the rejection region at the 2.5% significance level is  > 12.8325.
(True/False)
4.8/5 (29)
A nonparametric method to compare two or more populations, when the samples are independent and the data are either ordinal or interval but not normal, is the:
(Multiple Choice)
5.0/5 (45)
The nonparametric counterpart of the parametric one-way analysis of variance F-test is the:
(Multiple Choice)
4.7/5 (28)
The first step in a Wilcoxon rank sum test is to combine the data values in the two samples and assign a rank of 1 to the:
(Multiple Choice)
4.8/5 (23)
The Wilcoxon signed rank test is a nonparametric test that uses the directions of differences observed in a matched-pairs sample to determine whether the relative frequency distributions of two statistical populations are identical to or different from one another.
(True/False)
4.9/5 (30)
The Wilcoxon Rank Sum Test is a nonparametric test that can be used to compare two independent samples when the assumptions for a t-test are invalid.
(True/False)
4.8/5 (35)
Inferential procedures that are free from restrictive assumptions about the sampled populations are known as:
(Multiple Choice)
4.8/5 (37)
The general manager of a frozen TV dinner maker must decide which one of four new dinners to introduce to the market. He decides to perform an experiment to help make a decision. Each dinner is sampled by ten people who then rate the product on a 7-point scale, where 1 = poor, and 7 = excellent. The results are shown below. 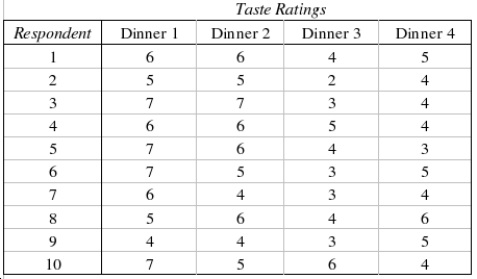 Which statistical technique the general manager can use to help him make a decision?
______________
Can the general manager infer at the 5% significance level that there are differences in the taste ratings of the four dinners?
Test Statistic: ______________
Reject Region:
Reject
Which statistical technique the general manager can use to help him make a decision?
______________
Can the general manager infer at the 5% significance level that there are differences in the taste ratings of the four dinners?
Test Statistic: ______________
Reject Region:
Reject  if test statistic > ______________
Conclude: ______________
The general manager ______________ infer at the 5% significance level that there are differences in the taste ratings of the four dinners.
Using the appropriate statistical table, what statement can be made about the p-value for this test?
______________
if test statistic > ______________
Conclude: ______________
The general manager ______________ infer at the 5% significance level that there are differences in the taste ratings of the four dinners.
Using the appropriate statistical table, what statement can be made about the p-value for this test?
______________
(Short Answer)
4.9/5 (28)
The significance level for a Wilcoxon signed rank test is 0.05. The alternative hypothesis is stated as: The location of population 1 is to the left of the location of population 2. The appropriate critical value for a sample of size 20 (that is the number of nonzero differences) is:
(Multiple Choice)
4.8/5 (31)
When the direction (and not the magnitude) of the difference within each matched paired in a paired experiment is known, the sign test can be used while the Wilcoxon Signed-Rank test cannot be used.
(True/False)
4.8/5 (42)
In a Friedman test for comparing four populations, provided that there as eight blocks, the test statistic is calculated as  = 10.98. If the test is conducted at the 5% significance level, the conclusion and p-value will be:
(Multiple Choice)
4.7/5 (39)
The Kruskal-Wallis test can be used to determine whether a difference exists between two populations. However, to determine whether one population location is larger than another, we must apply the Wilcoxon rank sum test.
(True/False)
4.9/5 (32)
Filters
- Essay(0)
- Multiple Choice(0)
- Short Answer(0)
- True False(0)
- Matching(0)