Exam 12: Linear Regression and Correlation
Exam 1: Describing Data With Graphs94 Questions
Exam 2: Describing Data With Numerical Measures186 Questions
Exam 3: Describing Bivariate Data35 Questions
Exam 4: Probability and Probability Distributions136 Questions
Exam 5: Several Useful Discrete Distributions129 Questions
Exam 6: The Normal Probability Distribution196 Questions
Exam 7: Sampling Distributions162 Questions
Exam 8: Large-Sample Estimation173 Questions
Exam 9: Large-Sample Tests of Hypotheses210 Questions
Exam 10: Inference From Small Samples261 Questions
Exam 11: The Analysis of Variance156 Questions
Exam 12: Linear Regression and Correlation165 Questions
Exam 13: Multiple Regression Analysis178 Questions
Exam 14: Analysis of Categorical Data136 Questions
Exam 15: Nonparametric Statistics198 Questions
Select questions type
In (all types of) regression analysis, a variable whose value is known and is being used to explain or predict the value of another variable is called:
Free
(Multiple Choice)
4.8/5  (26)
(26)
Correct Answer: Verified
A
If the sum of squares for error (SSE) is equal to zero, then the coefficient of determination (  ) must be:
Free
(Multiple Choice)
4.9/5 (29)
Correct Answer:Verified
B
If all the values of an independent variable x are equal, then regressing a dependent variable y on x will result in a coefficient of determination of zero.
Free
(True/False)
4.7/5 (35)
Correct Answer:Verified
True
The confidence interval estimate of the expected value of y will be narrower than the prediction interval for the same given value of x and confidence level. This is because there is less error in estimating a mean value as opposed to predicting an individual value.
(True/False)
4.8/5 (37)
In regression analysis, if the values of the dependent variable, y, decrease with larger values of the independent variable, x, the variables are said to have:
(Multiple Choice)
4.9/5 (40)
If a simple linear regression model is developed based on a sample where the independent and dependent variables are known to be positively related, then the sign of the slope regression coefficient will be positive also.
(True/False)
4.9/5 (30)
If a simple linear regression model has no y-intercept, then:
(Multiple Choice)
4.8/5 (24)
In a simple linear regression setting, the deterministic model equation determines an exact value of the dependent variable y when the value of the independent variable x is given, since all points must lie exactly on the line.
(True/False)
4.8/5 (37)
The regression model  = 36.5 + 20.1x has been computed based on a sample of 50 observations. One observation in the sample was (x, y) = (14, 350.9). Given this, the residual value for this observation is 33.
(True/False)
4.7/5 (38)
The value of the sum of squares for regression (SSR) can never be larger than 100.
(True/False)
4.9/5 (31)
The confidence interval estimate of the expected value of y will be wider than the prediction interval for the same given value of x and confidence level. This is because there is more error in estimating a mean value as opposed to predicting an individual value.
(True/False)
4.9/5 (34)
In order to predict with 99% confidence the expected value of y for a given value of x in a simple linear regression problem, a random sample of 10 observations is taken. Which of the following t-table values listed below would be used?
(Multiple Choice)
4.8/5 (36)
A scientist is studying the relationship between wind velocity (x) and DC output of a windmill (y). The following MINITAB output is from a regression analysis for predicting y from x. 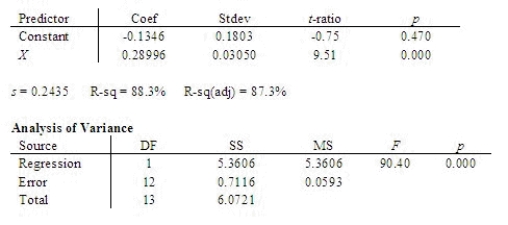 What is the least squares regression line?
  = ______________
Predict the DC output for a wind velocity of 22 mph.
______________
What is the value of the error sum of squares?
______________
One of the assumptions about the random error
= ______________
Predict the DC output for a wind velocity of 22 mph.
______________
What is the value of the error sum of squares?
______________
One of the assumptions about the random error  in the regression model is that the values of
  have a common variance equal to
  . What is the best estimator of
  ?
______________
What is the coefficient of determination?
______________
Does a linear relationship exist between x and y? Test using
?
______________
What is the coefficient of determination?
______________
Does a linear relationship exist between x and y? Test using  = 0.05.
What is the p-value?
______________
Conclude:
______________
A linear relationship ______________ exist between x and y.
= 0.05.
What is the p-value?
______________
Conclude:
______________
A linear relationship ______________ exist between x and y.
(Short Answer)
5.0/5 (35)
The value of the sum of squares for regression SSR can never be smaller than 1.
(True/False)
4.8/5 (33)
In developing a simple linear regression model, only one independent variable is used to explain the variation in a single dependent variable.
(True/False)
4.9/5 (26)
In regression analysis we use the Spearman rank correlation coefficient to measure and test to determine whether a relationship exists between the two variables if:
(Multiple Choice)
4.8/5 (28)
In order to estimate with 95% confidence the expected value of y for a given value of x in a simple linear regression problem, a random sample of 10 observations is taken. Which of the following t-table values listed below would be used?
(Multiple Choice)
4.8/5 (41)
In regression analysis, a careful study of the differences,  , between observed and estimated y values, given x (in order to decide whether crucial assumptions are fulfilled that allow valid inferences about the true regression line to be made from an estimated regression line) is called residual analysis.
(True/False)
5.0/5 (41)
In a simple linear regression analysis, if the t-test statistic for testing the significance of the regression model is 3.4, then the F-test statistic from the ANOVA table for regression will be 11.56.
(True/False)
4.8/5 (43)
A company manager is interested in the relationship between x = number of years that an employee has been with the company and y = the employee's annual salary (in thousands of dollars). The following statistical software output is from a regression analysis for predicting y from x for n = 15 data points. 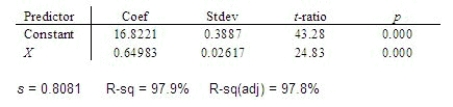 Find the correlation coefficient.
r = ______________
There is ______________ linear relationship between x and y.
Find the correlation coefficient.
r = ______________
There is ______________ linear relationship between x and y.
(Short Answer)
4.8/5 (35)
Filters
- Essay(0)
- Multiple Choice(0)
- Short Answer(0)
- True False(0)
- Matching(0)