Exam 2: Organizing and Visualizing Data
Exam 1: Introduction118 Questions
Exam 2: Organizing and Visualizing Data210 Questions
Exam 3: Numerical Descriptive Measures143 Questions
Exam 4: Basic Probability171 Questions
Exam 5: Discrete Probability Distributions137 Questions
Exam 6: The Normal Distribution145 Questions
Exam 7: Sampling and Sampling Distributions197 Questions
Exam 8: Confidence Interval Estimation185 Questions
Exam 9: Fundamentals of Hypothesis Testing: One-Sample Tests168 Questions
Exam 10: Two-Sample Tests and One-Way ANOVA293 Questions
Exam 11: Chi-Square Tests108 Questions
Exam 12: Simple Linear Regression213 Questions
Exam 13: Introduction to Multiple Regression291 Questions
Exam 14: Statistical Applications in Quality Management107 Questions
Select questions type
The percentage distribution cannot be constructed from the frequency distribution directly.
(True/False)
5.0/5  (37)
(37)
TABLE 2-11
The ordered array below resulted from selecting a sample of 25 batches of 500 computer chips and determining how many in each batch were defective.
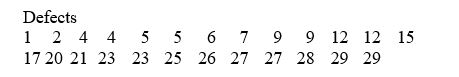 -Referring to Table 2-11, construct a frequency distribution for the defects data, using "0 but less than 5" as the first class.
(Essay)
4.8/5 (34)
TABLE 2-9
The frequency distribution below represents the rents of 250 randomly selected federally subsidized apartments in a small town.
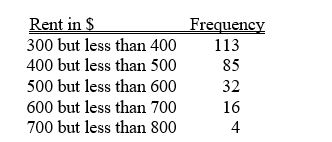 -Referring to Table 2-9, ________ percent of the apartments rented for $600 or more.
(Short Answer)
4.8/5 (38)
The sum of relative frequencies in a distribution always equals 1.
(True/False)
4.9/5 (36)
TABLE 2-8
The stem-and-leaf display represents the number of times in a year that a random sample of 100 "lifetime" members of a health club actually visited the facility.
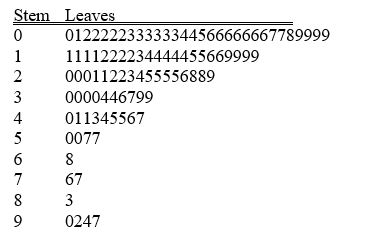 -Referring to Table 2-8, the person who visited the health club less than anyone else in the sample visited the facility ________ times.
(Short Answer)
4.9/5 (28)
TABLE 2-9
The frequency distribution below represents the rents of 250 randomly selected federally subsidized apartments in a small town.
-Referring to Table 2-9, ________ apartments rented for at least $400 but less than $600.
(Short Answer)
4.9/5 (29)
Apple Computer, Inc. collected information on the age of its customers. The youngest customer was 12 and the oldest was 72. To study the percentage of their customers who are below a certain age, it can use an ogive.
(True/False)
4.8/5 (38)
TABLE 2-12
The table below contains the opinions of a sample of 200 people broken down by gender about the latest congressional plan to eliminate anti-trust exemptions for professional baseball.
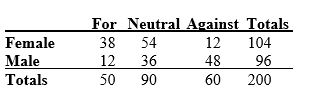 -Referring to Table 2-12, ________ percent of the 200 were females who were against the plan.
(Short Answer)
4.9/5 (34)
TABLE 2-4
A survey was conducted to determine how people rated the quality of programming available on television. Respondents were asked to rate the overall quality from 0 (no quality at all) to 100 (extremely good quality). The stem-and-leaf display of the data is shown below.
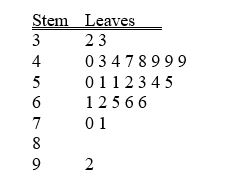 -Referring to Table 2-4, what percentage of the respondents rated overall television quality with a rating of 50 or below?
(Multiple Choice)
4.7/5 (39)
TABLE 2-12
The table below contains the opinions of a sample of 200 people broken down by gender about the latest congressional plan to eliminate anti-trust exemptions for professional baseball.
-Referring to Table 2-12, ________ percent of the 200 were against the plan.
(Short Answer)
4.8/5 (36)
Filters
- Essay(0)
- Multiple Choice(0)
- Short Answer(0)
- True False(0)
- Matching(0)