Exam 2: Organizing and Visualizing Data
Exam 1: Introduction118 Questions
Exam 2: Organizing and Visualizing Data210 Questions
Exam 3: Numerical Descriptive Measures143 Questions
Exam 4: Basic Probability171 Questions
Exam 5: Discrete Probability Distributions137 Questions
Exam 6: The Normal Distribution145 Questions
Exam 7: Sampling and Sampling Distributions197 Questions
Exam 8: Confidence Interval Estimation185 Questions
Exam 9: Fundamentals of Hypothesis Testing: One-Sample Tests168 Questions
Exam 10: Two-Sample Tests and One-Way ANOVA293 Questions
Exam 11: Chi-Square Tests108 Questions
Exam 12: Simple Linear Regression213 Questions
Exam 13: Introduction to Multiple Regression291 Questions
Exam 14: Statistical Applications in Quality Management107 Questions
Select questions type
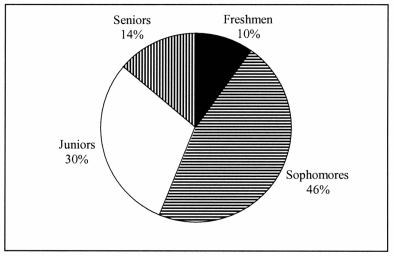
A professor of economics at a small Texas university wanted to determine what year in school students were taking his tough economics course. Shown below is a pie chart of the results. What percentage of the class took the course prior to reaching their senior year?
(Multiple Choice)
4.8/5  (34)
(34)
The larger the number of observations in a numerical data set, the larger the number of class intervals needed for a grouped frequency distribution.
(True/False)
4.8/5 (37)
The main principle behind the Pareto chart is the ability to separate the "vital few" from the "trivial many."
(True/False)
4.9/5 (41)
When comparing two or more large sets of numerical data, the distributions being developed should use the same ________.
(Short Answer)
4.8/5 (34)
True of False: To determine the width of class interval, divide the number of class groups by the range of the data.
(True/False)
4.8/5 (28)
TABLE 2-14
The table below contains the number of people who own a portable DVD player in a sample of 600 broken down by gender.
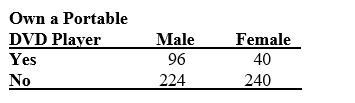 -Referring to Table 2-14, if the sample is a good representation of the population, we can expect ________ percent of those who own a portable DVD in the population will be males.
(Short Answer)
4.8/5 (37)
The stem-and-leaf display is often superior to the frequency distribution in that it maintains the original values for further analysis.
(True/False)
4.8/5 (29)
You have collected data on the number of complaints for six different brands of automobiles sold in the United States in 2006 and in 2010. Which of the following is the best for presenting the data?
(Multiple Choice)
4.8/5 (34)
TABLE 2-17
The following table presents total retail sales in millions of dollars for the leading apparel companies during April 2009 and April 2010.
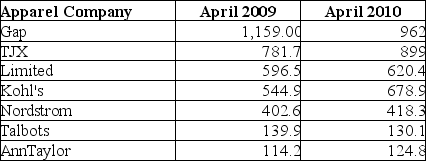 -Referring to Table 2-17, construct a table of column percentages.
(Essay)
4.8/5 (32)
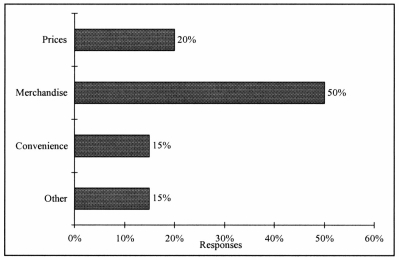
Retailers are always interested in determining why a customer selected their store to make a purchase. A sporting goods retailer conducted a customer survey to determine why its customers shopped at the store. The results are shown in the bar chart below. What proportion of the customers responded that they shopped at the store because of the merchandise or the convenience?
(Multiple Choice)
4.9/5 (29)
You have collected data on the number of U.S. households actively using online banking and/or online bill payment from 1995 to 2010. Which of the following is the best for presenting the data?
(Multiple Choice)
4.9/5 (35)
TABLE 2-18
The stem-and-leaf display below shows the result of a survey on 50 students on their satisfaction with their school with the higher scores represent higher level of satisfaction.
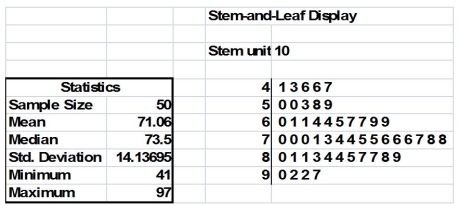 -Referring to Table 2-18, the level of satisfaction is concentrated around 75.
(True/False)
4.8/5 (37)
TABLE 2-8
The stem-and-leaf display represents the number of times in a year that a random sample of 100 "lifetime" members of a health club actually visited the facility.
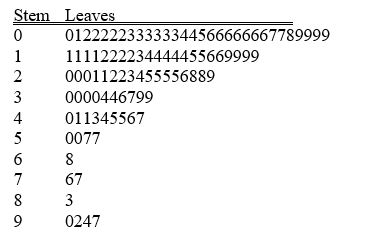 -Referring to Table 2-8, ________ of the 100 members visited the health club at least 52 times in a year.
(Short Answer)
4.9/5 (37)
A marketing research firm, in conducting a comparative taste test, provided three types of peanut butter to a sample of households randomly selected within the state. Which of the four methods of data collection is involved when people are asked to compare the three types of peanut butter?
(Multiple Choice)
4.8/5 (38)
TABLE 2-7
The stem-and-leaf display below contains data on the number of months between the date a civil suit is filed and when the case is actually adjudicated for 50 cases heard in superior court.
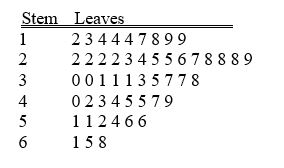 -Referring to Table 2-7, locate the first leaf, i.e., the lowest valued leaf with the lowest valued stem. This represents a wait of ________ months.
(Short Answer)
4.8/5 (32)
TABLE 2-14
The table below contains the number of people who own a portable DVD player in a sample of 600 broken down by gender.
-Referring to Table 2-14, if the sample is a good representation of the population, we can expect ________ percent of the population will own a portable DVD.
(Short Answer)
4.9/5 (38)
The personnel director at a large company studied the eating habits of the company's employees. The director noted whether employees brought their own lunches to work, ate at the company cafeteria, or went out to lunch. The goal of the study was to improve the food service at the company cafeteria. This type of data collection would best be considered as
(Multiple Choice)
4.9/5 (39)
TABLE 2-10
The histogram below represents scores achieved by 200 job applicants on a personality profile.
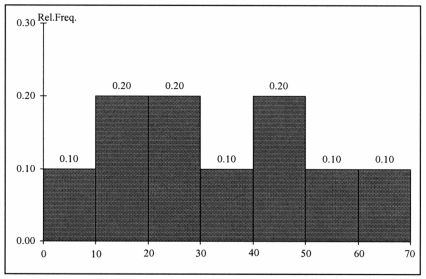 -Referring to the histogram from Table 2-10, the number of job applicants who scored between 30 and below 60 is ________.
(Short Answer)
4.9/5 (29)
TABLE 2-14
The table below contains the number of people who own a portable DVD player in a sample of 600 broken down by gender.
-Referring to Table 2-14, construct a table of total percentages.
(Essay)
4.8/5 (39)
TABLE 2-14
The table below contains the number of people who own a portable DVD player in a sample of 600 broken down by gender.
-Referring to Table 2-14, if the sample is a good representation of the population, we can expect ________ percent of the population will be males.
(Short Answer)
4.7/5 (30)
Filters
- Essay(0)
- Multiple Choice(0)
- Short Answer(0)
- True False(0)
- Matching(0)