Exam 2: Organizing and Visualizing Data
Exam 1: Introduction118 Questions
Exam 2: Organizing and Visualizing Data210 Questions
Exam 3: Numerical Descriptive Measures143 Questions
Exam 4: Basic Probability171 Questions
Exam 5: Discrete Probability Distributions137 Questions
Exam 6: The Normal Distribution145 Questions
Exam 7: Sampling and Sampling Distributions197 Questions
Exam 8: Confidence Interval Estimation185 Questions
Exam 9: Fundamentals of Hypothesis Testing: One-Sample Tests168 Questions
Exam 10: Two-Sample Tests and One-Way ANOVA293 Questions
Exam 11: Chi-Square Tests108 Questions
Exam 12: Simple Linear Regression213 Questions
Exam 13: Introduction to Multiple Regression291 Questions
Exam 14: Statistical Applications in Quality Management107 Questions
Select questions type
TABLE 2-12
The table below contains the opinions of a sample of 200 people broken down by gender about the latest congressional plan to eliminate anti-trust exemptions for professional baseball.
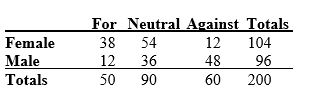 -Referring to Table 2-12, of those for the plan in the sample, ________ percent were females.
(Short Answer)
4.7/5  (38)
(38)
TABLE 2-14
The table below contains the number of people who own a portable DVD player in a sample of 600 broken down by gender.
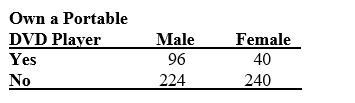 -Referring to Table 2-14, of those who owned a portable DVD in the sample, ________ percent were females.
(Short Answer)
4.8/5 (38)
TABLE 2-14
The table below contains the number of people who own a portable DVD player in a sample of 600 broken down by gender.
-Referring to Table 2-14, ________ percent of the 600 owned a portable DVD.
(Short Answer)
4.9/5 (36)
TABLE 2-8
The stem-and-leaf display represents the number of times in a year that a random sample of 100 "lifetime" members of a health club actually visited the facility.
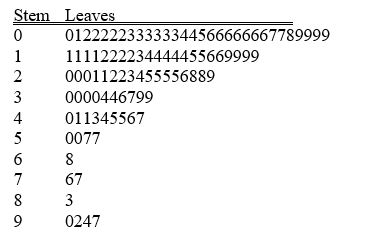 -Referring to Table 2-8, if a frequency distribution with equal sized classes was made from this data, and the first class was "0 but less than 10," the class midpoint of the third class would be ________.
(Short Answer)
4.8/5 (35)
TABLE 2-7
The stem-and-leaf display below contains data on the number of months between the date a civil suit is filed and when the case is actually adjudicated for 50 cases heard in superior court.
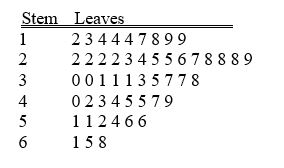 -Referring to Table 2-7, ________ percent of the cases were adjudicated within the first two years.
(Short Answer)
4.8/5 (25)
TABLE 2-8
The stem-and-leaf display represents the number of times in a year that a random sample of 100 "lifetime" members of a health club actually visited the facility.
-Referring to Table 2-8, the person who visited the health club more than anyone else in the sample visited the facility ________ times.
(Short Answer)
4.8/5 (32)
TABLE 2-14
The table below contains the number of people who own a portable DVD player in a sample of 600 broken down by gender.
-Referring to Table 2-14, if the sample is a good representation of the population, we can expect ________ percent of the females in the population will not own a portable DVD.
(Short Answer)
4.9/5 (23)
To evaluate two categorical variables at the same time, a ________ could be developed.
(Short Answer)
4.9/5 (32)
TABLE 2-12
The table below contains the opinions of a sample of 200 people broken down by gender about the latest congressional plan to eliminate anti-trust exemptions for professional baseball.
-Referring to Table 2-12, if the sample is a good representation of the population, we can expect ________ percent of those for the plan in the population will be males.
(Short Answer)
4.8/5 (41)
TABLE 2-2
At a meeting of information systems officers for regional offices of a national company, a survey was taken to determine the number of employees the officers supervise in the operation of their departments, where X is the number of employees overseen by each information systems officer.
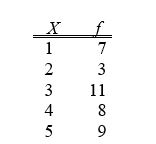 -The width of each bar in a histogram corresponds to the
(Multiple Choice)
4.9/5 (45)
Percentage polygons are plotted at the boundaries of the class groupings.
(True/False)
4.8/5 (35)
When constructing a frequency distribution, classes should be selected so that they are of equal width.
(True/False)
4.8/5 (27)
TABLE 2-5
The following are the duration in minutes of a sample of long-distance phone calls made within the continental United States reported by one long-distance carrier.
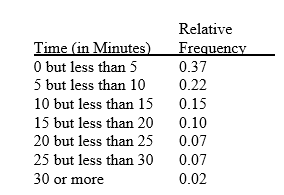 -Referring to Table 2-5, if 100 calls were randomly sampled, ________ of them would have lasted at least 15 minutes but less than 20 minutes
(Multiple Choice)
4.7/5 (32)
TABLE 2-14
The table below contains the number of people who own a portable DVD player in a sample of 600 broken down by gender.
-Referring to Table 2-14, of those who did not own a portable DVD in the sample, ________ percent were males.
(Short Answer)
4.7/5 (38)
TABLE 2-6
A sample of 200 students at a Big Ten university was taken after the midterm to ask them whether they went bar hopping the weekend before the midterm or spent the weekend studying, and whether they did well or poorly on the midterm. The following table contains the result.
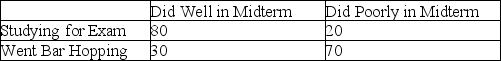 -Referring to Table 2-6, ________ percent of the students in the sample went bar hopping the weekend before the midterm and did well on the midterm.
(Multiple Choice)
4.8/5 (35)
TABLE 2-7
The stem-and-leaf display below contains data on the number of months between the date a civil suit is filed and when the case is actually adjudicated for 50 cases heard in superior court.
-Referring to Table 2-7, the civil suit with the fourth shortest waiting time between when the suit was filed and when it was adjudicated had a wait of ________ months.
(Short Answer)
4.8/5 (37)
TABLE 2-16
The figure below is the percentage polygon for the amount of calories for a sample of 36 pizzas products where the upper limits of the intervals are: 310, 340, 370, 400 and 430.
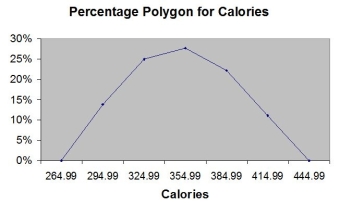 -Referring to Table 2-16, roughly what percentage of pizza products contain between 340 and 400 calories?
(Multiple Choice)
4.8/5 (34)
TABLE 2-12
The table below contains the opinions of a sample of 200 people broken down by gender about the latest congressional plan to eliminate anti-trust exemptions for professional baseball.
-Referring to Table 2-12, ________ percent of the 200 were males who were neutral.
(Short Answer)
5.0/5 (38)
TABLE 2-14
The table below contains the number of people who own a portable DVD player in a sample of 600 broken down by gender.
-Referring to Table 2-14, of the males in the sample, ________ percent owned a portable DVD.
(Short Answer)
4.8/5 (32)
Filters
- Essay(0)
- Multiple Choice(0)
- Short Answer(0)
- True False(0)
- Matching(0)