Exam 2: Organizing and Visualizing Data
Exam 1: Introduction118 Questions
Exam 2: Organizing and Visualizing Data210 Questions
Exam 3: Numerical Descriptive Measures143 Questions
Exam 4: Basic Probability171 Questions
Exam 5: Discrete Probability Distributions137 Questions
Exam 6: The Normal Distribution145 Questions
Exam 7: Sampling and Sampling Distributions197 Questions
Exam 8: Confidence Interval Estimation185 Questions
Exam 9: Fundamentals of Hypothesis Testing: One-Sample Tests168 Questions
Exam 10: Two-Sample Tests and One-Way ANOVA293 Questions
Exam 11: Chi-Square Tests108 Questions
Exam 12: Simple Linear Regression213 Questions
Exam 13: Introduction to Multiple Regression291 Questions
Exam 14: Statistical Applications in Quality Management107 Questions
Select questions type
TABLE 2-12
The table below contains the opinions of a sample of 200 people broken down by gender about the latest congressional plan to eliminate anti-trust exemptions for professional baseball.
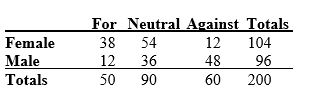 -Referring to Table 2-12, ________ percent of the 200 were not neutral.
(Short Answer)
4.8/5  (35)
(35)
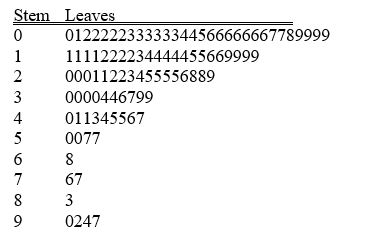
TABLE 2-18
The stem-and-leaf display below shows the result of a survey on 50 students on their satisfaction with their school with the higher scores represent higher level of satisfaction.
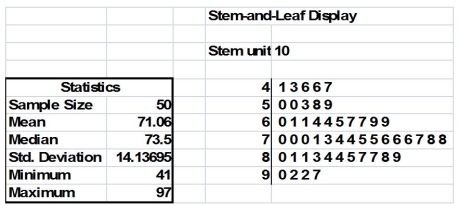 -Referring to Table 2-18, how many students have a satisfaction level of at least 80?
(Short Answer)
4.9/5 (26)
TABLE 2-13
Given below is the stem-and-leaf display representing the amount of detergent used in gallons (with leaves in tenths of gallons) in a day by 25 drive-through car wash operations in Phoenix.
9 | 147
10 | 02238
11 | 135566777
12 | 223489
13 | 02
-Referring to Table 2-13, construct a percentage polygon for the detergent data if the corresponding frequency distribution uses "9.0 but less than 10.0" as the first class.
(Essay)
4.8/5 (28)
TABLE 2-18
The stem-and-leaf display below shows the result of a survey on 50 students on their satisfaction with their school with the higher scores represent higher level of satisfaction.
-Referring to Table 2-18, what was the highest level of satisfaction?
(Short Answer)
4.8/5 (40)
TABLE 2-14
The table below contains the number of people who own a portable DVD player in a sample of 600 broken down by gender.
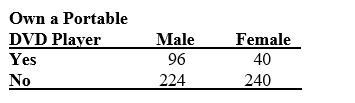 -Referring to Table 2-14, construct a table of column percentages.
(Essay)
4.7/5 (32)
Tim was planning for a meeting with his boss to discuss a raise in his annual salary. In preparation, he wanted to use the Consumer Price Index to determine the percentage increase in his real (inflation-adjusted)salary over the last three years. Which of the four methods of data collection was involved when he used the Consumer Price Index?
(Multiple Choice)
4.8/5 (33)
TABLE 2-13
Given below is the stem-and-leaf display representing the amount of detergent used in gallons (with leaves in tenths of gallons) in a day by 25 drive-through car wash operations in Phoenix.
9 | 147
10 | 02238
11 | 135566777
12 | 223489
13 | 02
-Referring to Table 2-13, if a relative frequency or percentage distribution for the detergent data is constructed, using "9.0 but less than 10.0 gallons" as the first class, what percentage of drive-through car wash operations use at least 10 gallons but less than 13 gallons of detergent in a day?
(Short Answer)
4.9/5 (32)
TABLE 2-5
The following are the duration in minutes of a sample of long-distance phone calls made within the continental United States reported by one long-distance carrier.
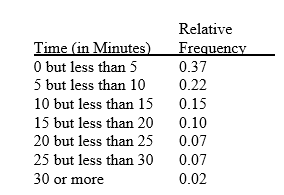 -Referring to Table 2-5, what is the width of each class?
(Multiple Choice)
4.9/5 (40)
A statistics student found a reference in the campus library that contained the median family incomes for all 50 states. She would report her data collection method as
(Multiple Choice)
4.8/5 (32)
TABLE 2-8
The stem-and-leaf display represents the number of times in a year that a random sample of 100 "lifetime" members of a health club actually visited the facility.
 -Referring to Table 2-8, if a frequency distribution with equal sized classes was made from this data, and the first class was "0 but less than 10," the relative frequency of the last class would be ________.
(Short Answer)
4.8/5 (32)
In order to compare one large set of numerical data to another, a ________ distribution must be developed from the frequency distribution.
(Short Answer)
4.8/5 (32)
When studying the simultaneous responses to two categorical questions, you should set up a
(Multiple Choice)
4.9/5 (32)
One of the developing countries is experiencing a baby boom, with the number of births rising for the fifth year in a row, according to a BBC News report. Which of the following is best for displaying this data?
(Multiple Choice)
4.9/5 (34)
TABLE 2-2
At a meeting of information systems officers for regional offices of a national company, a survey was taken to determine the number of employees the officers supervise in the operation of their departments, where X is the number of employees overseen by each information systems officer.
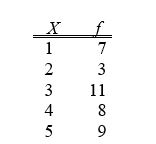 -Referring to Table 2-2, across all of the regional offices, how many total employees were supervised by those surveyed?
(Multiple Choice)
4.8/5 (39)
TABLE 2-13
Given below is the stem-and-leaf display representing the amount of detergent used in gallons (with leaves in tenths of gallons) in a day by 25 drive-through car wash operations in Phoenix.
9 | 147
10 | 02238
11 | 135566777
12 | 223489
13 | 02
-Referring to Table 2-13, if a relative frequency or percentage distribution for the detergent data is constructed, using "9.0 but less than 10.0 gallons" as the first class, what percentage of drive-through car wash operations use at least 10 gallons of detergent in a day?
(Short Answer)
4.9/5 (32)
If you wish to construct a graph of a relative frequency distribution, you would most likely construct an ogive first.
(True/False)
4.9/5 (32)
TABLE 2-5
The following are the duration in minutes of a sample of long-distance phone calls made within the continental United States reported by one long-distance carrier.
-Referring to Table 2-5, if 100 calls were randomly sampled, how many calls lasted 15 minutes or longer?
(Multiple Choice)
4.9/5 (30)
If the values of the seventh and eighth class in a cumulative percentage distribution are the same, we know that there are no observations in the eighth class.
(True/False)
4.9/5 (30)
In general, grouped frequency distributions should have between 5 and 15 class intervals.
(True/False)
4.8/5 (42)
TABLE 2-17
The following table presents total retail sales in millions of dollars for the leading apparel companies during April 2009 and April 2010.
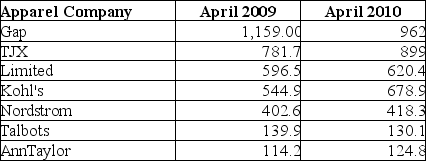 -Referring to Table 2-17, construct a side-by-side bar chart.
(Essay)
4.8/5 (41)
Filters
- Essay(0)
- Multiple Choice(0)
- Short Answer(0)
- True False(0)
- Matching(0)