Exam 2: Organizing and Visualizing Data
Exam 1: Introduction118 Questions
Exam 2: Organizing and Visualizing Data210 Questions
Exam 3: Numerical Descriptive Measures143 Questions
Exam 4: Basic Probability171 Questions
Exam 5: Discrete Probability Distributions137 Questions
Exam 6: The Normal Distribution145 Questions
Exam 7: Sampling and Sampling Distributions197 Questions
Exam 8: Confidence Interval Estimation185 Questions
Exam 9: Fundamentals of Hypothesis Testing: One-Sample Tests168 Questions
Exam 10: Two-Sample Tests and One-Way ANOVA293 Questions
Exam 11: Chi-Square Tests108 Questions
Exam 12: Simple Linear Regression213 Questions
Exam 13: Introduction to Multiple Regression291 Questions
Exam 14: Statistical Applications in Quality Management107 Questions
Select questions type
TABLE 2-6
A sample of 200 students at a Big Ten university was taken after the midterm to ask them whether they went bar hopping the weekend before the midterm or spent the weekend studying, and whether they did well or poorly on the midterm. The following table contains the result.
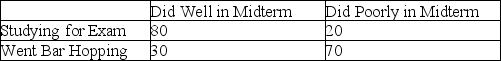 -Referring to Table 2-6, if the sample is a good representation of the population, we can expect ________ percent of those who spent the weekend studying to do poorly on the midterm.
(Multiple Choice)
5.0/5  (30)
(30)
In general, a frequency distribution should have at least 8 class groups but no more than 20.
(True/False)
4.7/5 (42)
TABLE 2-12
The table below contains the opinions of a sample of 200 people broken down by gender about the latest congressional plan to eliminate anti-trust exemptions for professional baseball.
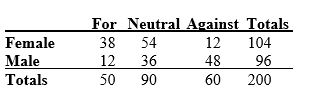 -Referring to Table 2-12, ________ percent of the 200 were males who were not against the plan.
(Short Answer)
4.9/5 (28)
When constructing charts, the following is plotted at the class midpoints:
(Multiple Choice)
4.8/5 (29)
You have collected data on the monthly seasonally adjusted civilian unemployment rate for the United States from 1998 to 2010. Which of the following is the best for presenting the data?
(Multiple Choice)
4.8/5 (30)
The point halfway between the boundaries of each class interval in a grouped frequency distribution is called the ________.
(Short Answer)
4.7/5 (40)
TABLE 2-16
The figure below is the percentage polygon for the amount of calories for a sample of 36 pizzas products where the upper limits of the intervals are: 310, 340, 370, 400 and 430.
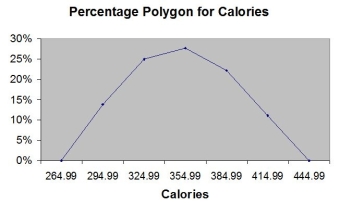 -Referring to Table 2-16, roughly what percentage of pizza products contain at least 340 calories?
(Multiple Choice)
4.8/5 (42)
You have collected data on the responses to two questions asked in a survey of 40 college students majoring in business, What is your gender (Male = M; Female = F)and What is your major (Accountancy = A; Computer Information Systems = C; Marketing = M). Which of the following is the best for presenting the data?
(Multiple Choice)
4.8/5 (41)
TABLE 2-10
The histogram below represents scores achieved by 200 job applicants on a personality profile.
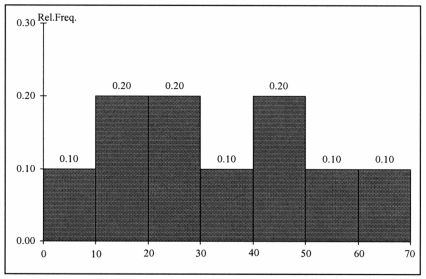 -Referring to the histogram from Table 2-10, the number of job applicants who scored 50 or above is ________.
(Short Answer)
4.9/5 (37)
The percentage polygon is formed by having the lower boundary of each class represent the data in that class and then connecting the sequence of lower boundaries at their respective class percentages.
(True/False)
4.9/5 (28)
In a survey, 150 executives were asked what they think is the most common mistake candidates make during job interviews. Six different mistakes were given. Which of the following is the best for presenting the information?
(Multiple Choice)
4.8/5 (34)
TABLE 2-16
The figure below is the percentage polygon for the amount of calories for a sample of 36 pizzas products where the upper limits of the intervals are: 310, 340, 370, 400 and 430.
-Referring to Table 2-16, roughly what percentage of pizza products contain between 400 and 430 calories?
(Multiple Choice)
4.9/5 (33)
Data on 1,500 students' height were collected at a larger university in the East Coast. Which of the following is the best chart for presenting the information?
(Multiple Choice)
4.8/5 (40)
TABLE 2-13
Given below is the stem-and-leaf display representing the amount of detergent used in gallons (with leaves in tenths of gallons) in a day by 25 drive-through car wash operations in Phoenix.
9 | 147
10 | 02238
11 | 135566777
12 | 223489
13 | 02
-Referring to Table 2-13, construct a percentage histogram for the detergent data, using "9.0 but less than 10.0" as the first class.
(Essay)
4.7/5 (36)
TABLE 2-10
The histogram below represents scores achieved by 200 job applicants on a personality profile.
-Referring to the histogram from Table 2-10, half of the job applicants scored below ________.
(Short Answer)
4.8/5 (34)
A good choice for the number of class groups to use in constructing frequency distribution is to have at least 5 but no more than 15 class groups.
(True/False)
4.9/5 (40)
TABLE 2-13
Given below is the stem-and-leaf display representing the amount of detergent used in gallons (with leaves in tenths of gallons) in a day by 25 drive-through car wash operations in Phoenix.
9 | 147
10 | 02238
11 | 135566777
12 | 223489
13 | 02
-Referring to Table 2-13, if a percentage histogram for the detergent data is constructed, using "9.0 but less than 10.0 gallons" as the first class, what percentage of drive-through car wash operations use less than 12 gallons of detergent in a day?
(Short Answer)
5.0/5 (36)
It is essential that each class grouping or interval in a frequency distribution be ________ and ________.
(Short Answer)
4.8/5 (33)
TABLE 2-8
The stem-and-leaf display represents the number of times in a year that a random sample of 100 "lifetime" members of a health club actually visited the facility.
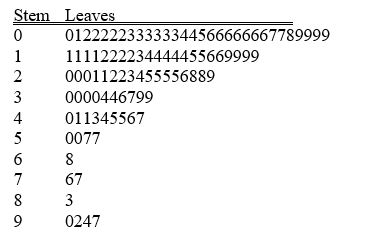 -Referring to Table 2-8, if a frequency distribution with equal sized classes was made from this data, and the first class was "0 but less than 10," the frequency of the fifth class would be ________.
(Short Answer)
4.8/5 (35)
TABLE 2-11
The ordered array below resulted from selecting a sample of 25 batches of 500 computer chips and determining how many in each batch were defective.
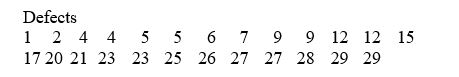 -Referring to Table 2-11, construct a relative frequency or percentage distribution for the defects data, using "0 but less than 5" as the first class.
(Essay)
4.8/5 (45)
Filters
- Essay(0)
- Multiple Choice(0)
- Short Answer(0)
- True False(0)
- Matching(0)