Exam 2: Organizing and Visualizing Data
Exam 1: Introduction118 Questions
Exam 2: Organizing and Visualizing Data210 Questions
Exam 3: Numerical Descriptive Measures143 Questions
Exam 4: Basic Probability171 Questions
Exam 5: Discrete Probability Distributions137 Questions
Exam 6: The Normal Distribution145 Questions
Exam 7: Sampling and Sampling Distributions197 Questions
Exam 8: Confidence Interval Estimation185 Questions
Exam 9: Fundamentals of Hypothesis Testing: One-Sample Tests168 Questions
Exam 10: Two-Sample Tests and One-Way ANOVA293 Questions
Exam 11: Chi-Square Tests108 Questions
Exam 12: Simple Linear Regression213 Questions
Exam 13: Introduction to Multiple Regression291 Questions
Exam 14: Statistical Applications in Quality Management107 Questions
Select questions type
TABLE 2-12
The table below contains the opinions of a sample of 200 people broken down by gender about the latest congressional plan to eliminate anti-trust exemptions for professional baseball.
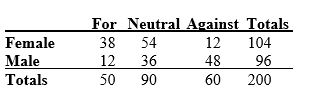 -Referring to Table 2-12, construct a table of row percentages.
(Essay)
4.9/5  (31)
(31)
TABLE 2-4
A survey was conducted to determine how people rated the quality of programming available on television. Respondents were asked to rate the overall quality from 0 (no quality at all) to 100 (extremely good quality). The stem-and-leaf display of the data is shown below.
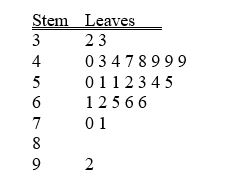 -Referring to Table 2-4, what percentage of the respondents rated overall television quality with a rating of 80 or above?
(Multiple Choice)
4.7/5 (37)
TABLE 2-14
The table below contains the number of people who own a portable DVD player in a sample of 600 broken down by gender.
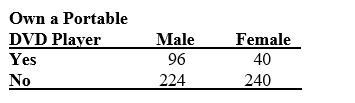 -Referring to Table 2-14, ________ percent of the 600 were females.
(Short Answer)
4.9/5 (32)
TABLE 2-12
The table below contains the opinions of a sample of 200 people broken down by gender about the latest congressional plan to eliminate anti-trust exemptions for professional baseball.
-Referring to Table 2-12, construct a table of column percentages.
(Essay)
4.8/5 (33)
TABLE 2-5
The following are the duration in minutes of a sample of long-distance phone calls made within the continental United States reported by one long-distance carrier.
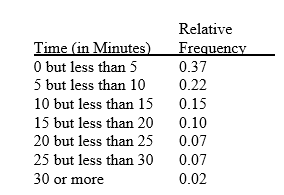 -Referring to Table 2-5, if 100 calls were sampled, ________ of them would have lasted 20 minutes or more.
(Multiple Choice)
4.8/5 (37)
TABLE 2-4
A survey was conducted to determine how people rated the quality of programming available on television. Respondents were asked to rate the overall quality from 0 (no quality at all) to 100 (extremely good quality). The stem-and-leaf display of the data is shown below.
-Referring to Table 2-4, what percentage of the respondents rated overall television quality with a rating from 50 through 75?
(Multiple Choice)
4.7/5 (36)
TABLE 2-14
The table below contains the number of people who own a portable DVD player in a sample of 600 broken down by gender.
-Referring to Table 2-14, construct a table of row percentages.
(Essay)
4.8/5 (36)
In constructing a polygon, each class grouping is represented by its ________ and then these are consecutively connected to one another.
(Short Answer)
4.8/5 (49)
Which of the four methods of data collection is involved when a person counts the number of cars passing designated locations on the Los Angeles freeway system?
(Multiple Choice)
4.8/5 (36)
Given below is the scatter plot of the price/earnings ratio versus earnings per share of 20 U.S. companies. There appear to be a positive relationship between price/earnings ratio and earnings per share.
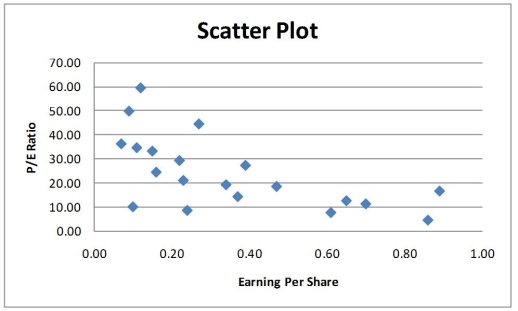
(True/False)
4.8/5 (31)
TABLE 2-14
The table below contains the number of people who own a portable DVD player in a sample of 600 broken down by gender.
-Referring to Table 2-14, ________ percent of the 600 did not own a portable DVD.
(Short Answer)
4.8/5 (39)
The original data values cannot be determined once they are grouped into a frequency distribution table.
(True/False)
4.8/5 (28)
Given below is the scatter plot of the market value (thousands$)and profit (thousands$)of 50 U.S. companies. Higher market values appear to be associated with higher profits.
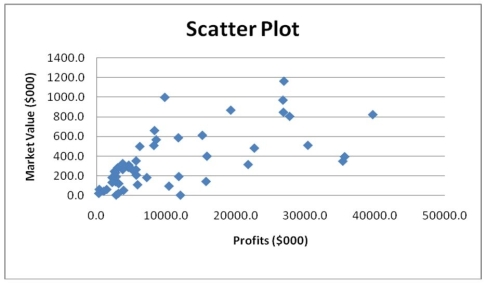
(True/False)
4.7/5 (42)
TABLE 2-9
The frequency distribution below represents the rents of 250 randomly selected federally subsidized apartments in a small town.
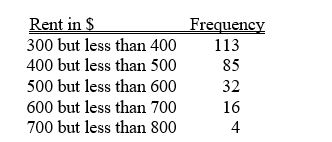 -Referring to Table 2-9, the class midpoint of the second class is ________.
(Short Answer)
4.7/5 (32)
TABLE 2-14
The table below contains the number of people who own a portable DVD player in a sample of 600 broken down by gender.
-Referring to Table 2-14, ________ percent of the 600 were females who owned a portable DVD.
(Short Answer)
4.8/5 (25)
Apple Computer, Inc. collected information on the age of its customers. The youngest customer was 12 and the oldest was 72. To study the distribution of the age among its customers, it is best to use a pie chart.
(True/False)
4.9/5 (32)
TABLE 2-13
Given below is the stem-and-leaf display representing the amount of detergent used in gallons (with leaves in tenths of gallons) in a day by 25 drive-through car wash operations in Phoenix.
9 | 147
10 | 02238
11 | 135566777
12 | 223489
13 | 02
-Referring to Table 2-13, construct a frequency distribution for the detergent data, using "9.0 but less than 10.0 gallons" as the first class.
(Essay)
4.8/5 (39)
Which of the following is appropriate for displaying data collected on the different brands of cars that students at a major university drive?
(Multiple Choice)
4.8/5 (35)
Jared was working on a project to look at global warming and accessed an Internet site where he captured average global surface temperatures from 1866. Which of the four methods of data collection was he using?
(Multiple Choice)
4.8/5 (42)
The relative frequency is the frequency in each class divided by the total number of observations.
(True/False)
4.9/5 (43)
Filters
- Essay(0)
- Multiple Choice(0)
- Short Answer(0)
- True False(0)
- Matching(0)