Exam 2: Organizing and Visualizing Data
Exam 1: Introduction118 Questions
Exam 2: Organizing and Visualizing Data210 Questions
Exam 3: Numerical Descriptive Measures143 Questions
Exam 4: Basic Probability171 Questions
Exam 5: Discrete Probability Distributions137 Questions
Exam 6: The Normal Distribution145 Questions
Exam 7: Sampling and Sampling Distributions197 Questions
Exam 8: Confidence Interval Estimation185 Questions
Exam 9: Fundamentals of Hypothesis Testing: One-Sample Tests168 Questions
Exam 10: Two-Sample Tests and One-Way ANOVA293 Questions
Exam 11: Chi-Square Tests108 Questions
Exam 12: Simple Linear Regression213 Questions
Exam 13: Introduction to Multiple Regression291 Questions
Exam 14: Statistical Applications in Quality Management107 Questions
Select questions type
The width of each class grouping or interval in a frequency distribution should be ________.
(Short Answer)
4.7/5  (40)
(40)
TABLE 2-14
The table below contains the number of people who own a portable DVD player in a sample of 600 broken down by gender.
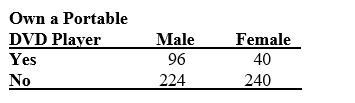 -Referring to Table 2-14, of the females in the sample, ________ percent did not own a portable DVD.
(Short Answer)
5.0/5 (35)
TABLE 2-11
The ordered array below resulted from selecting a sample of 25 batches of 500 computer chips and determining how many in each batch were defective.
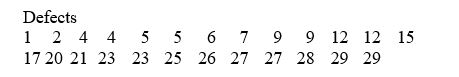 -Referring to Table 2-11, if a frequency distribution for the defects data is constructed, using "0 but less than 5" as the first class, the relative frequency of the "15 but less than 20" class would be ________.
(Short Answer)
4.9/5 (32)
In graphing two categorical data, the side-by-side bar chart is best suited when comparing joint responses.
(True/False)
4.7/5 (36)
Relationships in a contingency table can be examined more fully if the frequencies are converted into ________.
(Short Answer)
4.9/5 (32)
TABLE 2-14
The table below contains the number of people who own a portable DVD player in a sample of 600 broken down by gender.
-Referring to Table 2-14, if the sample is a good representation of the population, we can expect ________ percent of the males in the population will own a portable DVD.
(Short Answer)
5.0/5 (29)
TABLE 2-11
The ordered array below resulted from selecting a sample of 25 batches of 500 computer chips and determining how many in each batch were defective.
-Referring to Table 2-11, construct a histogram for the defects data, using "0 but less than 5" as the first class.
(Essay)
4.7/5 (34)
Given below is the scatter plot of the number of employees and the total revenue ($millions)of 20 U.S. companies. There appears to be a positive relationship between total revenue and the number of employees.
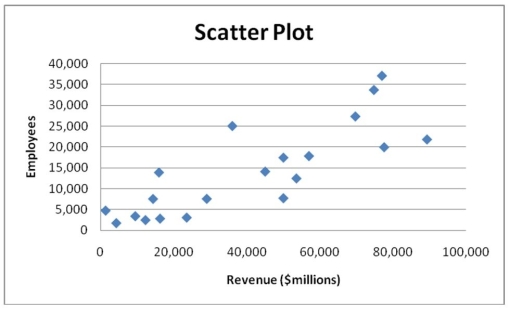
(True/False)
4.9/5 (34)
A histogram can have gaps between the bars, whereas bar charts cannot have gaps.
(True/False)
4.8/5 (33)
TABLE 2-13
Given below is the stem-and-leaf display representing the amount of detergent used in gallons (with leaves in tenths of gallons) in a day by 25 drive-through car wash operations in Phoenix.
9 | 147
10 | 02238
11 | 135566777
12 | 223489
13 | 02
-Referring to Table 2-13, construct a relative frequency or percentage distribution for the detergent data, using "9.0 but less than 10.0" as the first class.
(Essay)
4.8/5 (32)
TABLE 2-10
The histogram below represents scores achieved by 200 job applicants on a personality profile.
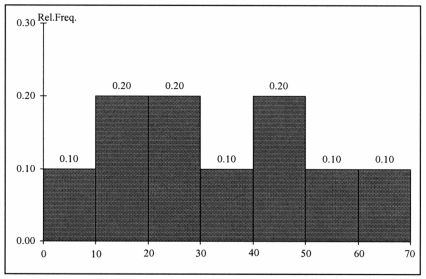 -Referring to the histogram from Table 2-10, ________ percent of the applicants scored between 20 and below 50.
(Short Answer)
4.8/5 (32)
TABLE 2-7
The stem-and-leaf display below contains data on the number of months between the date a civil suit is filed and when the case is actually adjudicated for 50 cases heard in superior court.
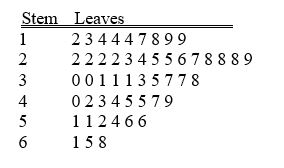 -Referring to Table 2-7, the civil suit with the longest wait between when the suit was filed and when it was adjudicated had a wait of ________ months.
(Short Answer)
4.8/5 (32)
Histograms are used for numerical data while bar charts are suitable for categorical data.
(True/False)
4.9/5 (31)
TABLE 2-3
Every spring semester, the School of Business coordinates a luncheon with local business leaders for graduating seniors, their families, and friends. Corporate sponsorship pays for the lunches of each of the seniors, but students have to purchase tickets to cover the cost of lunches served to guests they bring with them. The following histogram represents the attendance at the senior luncheon, where X is the number of guests each graduating senior invited to the luncheon and f is the number of graduating seniors in each category.
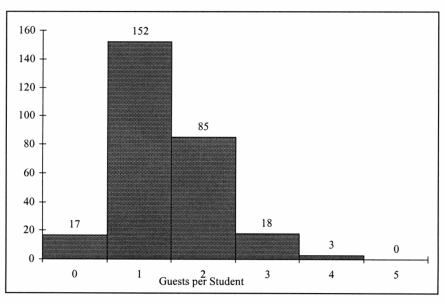 -Referring to the histogram from Table 2-3, how many graduating seniors attended the luncheon?
(Multiple Choice)
4.9/5 (39)
TABLE 2-6
A sample of 200 students at a Big Ten university was taken after the midterm to ask them whether they went bar hopping the weekend before the midterm or spent the weekend studying, and whether they did well or poorly on the midterm. The following table contains the result.
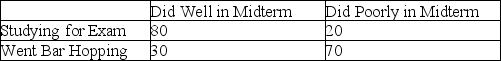 -Referring to Table 2-6, of the students in the sample who went bar hopping the weekend before the midterm, ________ percent did well on the midterm.
(Multiple Choice)
4.9/5 (42)
TABLE 2-7
The stem-and-leaf display below contains data on the number of months between the date a civil suit is filed and when the case is actually adjudicated for 50 cases heard in superior court.
-Referring to Table 2-7, ________ percent of the cases were not adjudicated within the first four years.
(Short Answer)
4.8/5 (40)
TABLE 2-1
An insurance company evaluates many numerical variables about a person before deciding on an appropriate rate for automobile insurance. A representative from a local insurance agency selected a random sample of insured drivers and recorded, X, the number of claims each made in the last three years, with the following results.
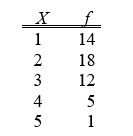 -Referring to Table 2-1, how many drivers are represented in the sample?
(Multiple Choice)
4.8/5 (34)
You have collected data on the approximate retail price (in $)and the energy cost per year (in $)of 15 refrigerators. Which of the following is the best for presenting the data?
(Multiple Choice)
4.9/5 (34)
TABLE 2-5
The following are the duration in minutes of a sample of long-distance phone calls made within the continental United States reported by one long-distance carrier.
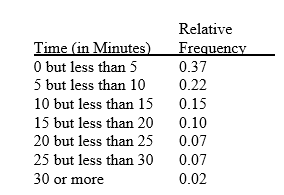 -Referring to Table 2-5, if 1,000 calls were randomly sampled, how many calls lasted under 10 minutes?
(Multiple Choice)
4.8/5 (44)
A ________ is a summary table in which numerical data are tallied into class intervals or categories.
(Short Answer)
4.9/5 (40)
Filters
- Essay(0)
- Multiple Choice(0)
- Short Answer(0)
- True False(0)
- Matching(0)