Exam 2: Organizing and Visualizing Data
Exam 1: Introduction118 Questions
Exam 2: Organizing and Visualizing Data210 Questions
Exam 3: Numerical Descriptive Measures143 Questions
Exam 4: Basic Probability171 Questions
Exam 5: Discrete Probability Distributions137 Questions
Exam 6: The Normal Distribution145 Questions
Exam 7: Sampling and Sampling Distributions197 Questions
Exam 8: Confidence Interval Estimation185 Questions
Exam 9: Fundamentals of Hypothesis Testing: One-Sample Tests168 Questions
Exam 10: Two-Sample Tests and One-Way ANOVA293 Questions
Exam 11: Chi-Square Tests108 Questions
Exam 12: Simple Linear Regression213 Questions
Exam 13: Introduction to Multiple Regression291 Questions
Exam 14: Statistical Applications in Quality Management107 Questions
Select questions type
A study attempted to estimate the proportion of Florida residents who were willing to spend more tax dollars on protecting the beaches from environmental disasters. Twenty-five hundred Florida residents were surveyed. What type of data collection procedure was most likely used to collect the data for this study?
(Multiple Choice)
4.8/5  (33)
(33)
TABLE 2-13
Given below is the stem-and-leaf display representing the amount of detergent used in gallons (with leaves in tenths of gallons) in a day by 25 drive-through car wash operations in Phoenix.
9 | 147
10 | 02238
11 | 135566777
12 | 223489
13 | 02
-Referring to Table 2-13, construct a cumulative percentage distribution for the detergent data if the corresponding frequency distribution uses "9.0 but less than 10.0" as the first class.
(Essay)
4.8/5 (39)
TABLE 2-11
The ordered array below resulted from selecting a sample of 25 batches of 500 computer chips and determining how many in each batch were defective.
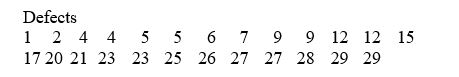 -Referring to Table 2-11, construct a cumulative percentage polygon for the defects data if the corresponding frequency distribution uses "0 but less than 5" as the first class.
(Essay)
4.9/5 (36)
TABLE 2-11
The ordered array below resulted from selecting a sample of 25 batches of 500 computer chips and determining how many in each batch were defective.
-Referring to Table 2-11, if a frequency distribution for the defects data is constructed, using "0 but less than 5" as the first class, the frequency of the "20 but less than 25" class would be ________.
(Short Answer)
4.9/5 (36)
TABLE 2-18
The stem-and-leaf display below shows the result of a survey on 50 students on their satisfaction with their school with the higher scores represent higher level of satisfaction.
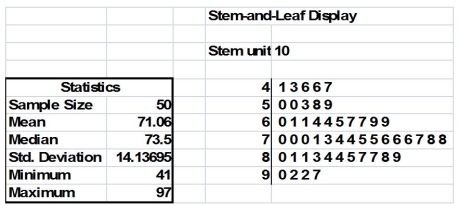 -Referring to Table 2-18, how many students have a satisfaction level below 60?
(Short Answer)
4.9/5 (40)
TABLE 2-6
A sample of 200 students at a Big Ten university was taken after the midterm to ask them whether they went bar hopping the weekend before the midterm or spent the weekend studying, and whether they did well or poorly on the midterm. The following table contains the result.
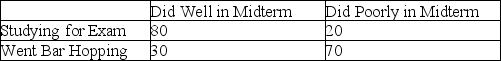 -Referring to Table 2-6, if the sample is a good representation of the population, we can expect ________ percent of those who did poorly on the midterm to have spent the weekend studying.
(Multiple Choice)
4.9/5 (43)
TABLE 2-8
The stem-and-leaf display represents the number of times in a year that a random sample of 100 "lifetime" members of a health club actually visited the facility.
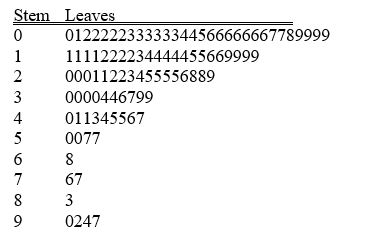 -Referring to Table 2-8, if a frequency distribution with equal sized classes was made from this data, and the first class was "0 but less than 10," the cumulative percentage of the next-to-last class would be ________.
(Short Answer)
4.8/5 (33)
A research analyst was directed to arrange raw data collected on the yield of wheat, ranging from 40 to 93 bushels per acre, in a frequency distribution. He should choose 30 as the class interval width.
(True/False)
4.8/5 (41)
A Walmart store in a small town monitors customer complaints and organizes these complaints into six distinct categories. Over the past year, the company has received 534 complaints. One possible graphical method for representing these data would be a Pareto chart.
(True/False)
4.8/5 (33)
TABLE 2-12
The table below contains the opinions of a sample of 200 people broken down by gender about the latest congressional plan to eliminate anti-trust exemptions for professional baseball.
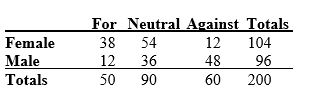 -Referring to Table 2-12, if the sample is a good representation of the population, we can expect ________ percent of the females in the population will not be against the plan.
(Short Answer)
4.9/5 (44)
TABLE 2-12
The table below contains the opinions of a sample of 200 people broken down by gender about the latest congressional plan to eliminate anti-trust exemptions for professional baseball.
-Referring to Table 2-12, if the sample is a good representation of the population, we can expect ________ percent of the males in the population will be against the plan.
(Short Answer)
4.8/5 (37)
TABLE 2-13
Given below is the stem-and-leaf display representing the amount of detergent used in gallons (with leaves in tenths of gallons) in a day by 25 drive-through car wash operations in Phoenix.
9 | 147
10 | 02238
11 | 135566777
12 | 223489
13 | 02
-Referring to Table 2-13, if a frequency distribution for the amount of detergent used is constructed, using "9.0 but less than 10.0 gallons" as the first class, the frequency of the "11.0 but less than 12.0 gallons" class would be ________.
(Short Answer)
4.8/5 (40)
TABLE 2-11
The ordered array below resulted from selecting a sample of 25 batches of 500 computer chips and determining how many in each batch were defective.
-Referring to Table 2-11, construct a cumulative percentage distribution for the defects data if the corresponding frequency distribution uses "0 but less than 5" as the first class.
(Essay)
4.8/5 (32)
TABLE 2-9
The frequency distribution below represents the rents of 250 randomly selected federally subsidized apartments in a small town.
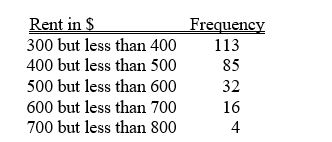 -Referring to Table 2-9, the relative frequency of the second class is ________.
(Short Answer)
4.7/5 (33)
One of the advantages of a pie chart is that it clearly shows that the total of all the categories of the pie adds to 100%.
(True/False)
4.9/5 (34)
TABLE 2-18
The stem-and-leaf display below shows the result of a survey on 50 students on their satisfaction with their school with the higher scores represent higher level of satisfaction.
-Referring to Table 2-18, how many students have a satisfaction level in the 50s?
(Short Answer)
4.9/5 (34)
A ________ is a vertical bar chart in which the rectangular bars are constructed at the boundaries of each class interval.
(Short Answer)
4.8/5 (35)
TABLE 2-17
The following table presents total retail sales in millions of dollars for the leading apparel companies during April 2009 and April 2010.
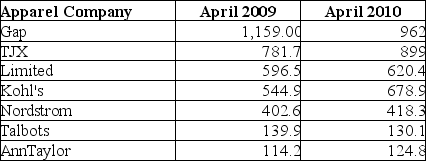 -Referring to Table 2-17, among the 8 stores, ________ saw a sales decline.
(Short Answer)
4.9/5 (27)
TABLE 2-17
The following table presents total retail sales in millions of dollars for the leading apparel companies during April 2009 and April 2010.
-Referring to Table 2-17, in general, retail sales for the apparel industry have seen a modest growth between April 2008 and April 2009.
(True/False)
4.8/5 (34)
Filters
- Essay(0)
- Multiple Choice(0)
- Short Answer(0)
- True False(0)
- Matching(0)