Exam 2: Organizing and Visualizing Data
Exam 1: Introduction118 Questions
Exam 2: Organizing and Visualizing Data210 Questions
Exam 3: Numerical Descriptive Measures143 Questions
Exam 4: Basic Probability171 Questions
Exam 5: Discrete Probability Distributions137 Questions
Exam 6: The Normal Distribution145 Questions
Exam 7: Sampling and Sampling Distributions197 Questions
Exam 8: Confidence Interval Estimation185 Questions
Exam 9: Fundamentals of Hypothesis Testing: One-Sample Tests168 Questions
Exam 10: Two-Sample Tests and One-Way ANOVA293 Questions
Exam 11: Chi-Square Tests108 Questions
Exam 12: Simple Linear Regression213 Questions
Exam 13: Introduction to Multiple Regression291 Questions
Exam 14: Statistical Applications in Quality Management107 Questions
Select questions type
Determining the class boundaries of a frequency distribution is highly subjective.
(True/False)
4.8/5  (42)
(42)
You have collected information on the market share of five different search engines used by U.S. Internet users in January 2011. Which of the following is the best for presenting the information?
(Multiple Choice)
5.0/5 (40)
TABLE 2-6
A sample of 200 students at a Big Ten university was taken after the midterm to ask them whether they went bar hopping the weekend before the midterm or spent the weekend studying, and whether they did well or poorly on the midterm. The following table contains the result.
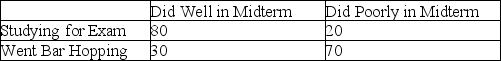 -Referring to Table 2-6, of the students in the sample who did well on the midterm, ________ percent went bar hopping the weekend before the midterm.
(Multiple Choice)
5.0/5 (33)
TABLE 2-12
The table below contains the opinions of a sample of 200 people broken down by gender about the latest congressional plan to eliminate anti-trust exemptions for professional baseball.
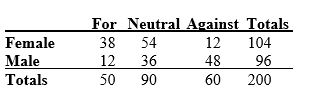 -Referring to Table 2-12, construct a table of total percentages.
(Essay)
4.7/5 (34)
TABLE 2-2
At a meeting of information systems officers for regional offices of a national company, a survey was taken to determine the number of employees the officers supervise in the operation of their departments, where X is the number of employees overseen by each information systems officer.
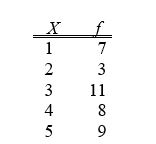 -Referring to Table 2-2, how many regional offices are represented in the survey results?
(Multiple Choice)
4.9/5 (29)
TABLE 2-1
An insurance company evaluates many numerical variables about a person before deciding on an appropriate rate for automobile insurance. A representative from a local insurance agency selected a random sample of insured drivers and recorded, X, the number of claims each made in the last three years, with the following results.
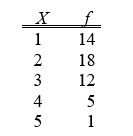 -Referring to Table 2-1, how many total claims are represented in the sample?
(Multiple Choice)
4.8/5 (46)
TABLE 2-13
Given below is the stem-and-leaf display representing the amount of detergent used in gallons (with leaves in tenths of gallons) in a day by 25 drive-through car wash operations in Phoenix.
9 | 147
10 | 02238
11 | 135566777
12 | 223489
13 | 02
-Referring to Table 2-13, construct a cumulative percentage polygon for the detergent data if the corresponding frequency distribution uses "9.0 but less than 10.0" as the first class.
(Essay)
4.8/5 (38)
TABLE 2-6
A sample of 200 students at a Big Ten university was taken after the midterm to ask them whether they went bar hopping the weekend before the midterm or spent the weekend studying, and whether they did well or poorly on the midterm. The following table contains the result.
-Referring to Table 2-6, if the sample is a good representation of the population, we can expect ________ percent of the students in the population to spend the weekend studying and do poorly on the midterm.
(Multiple Choice)
4.7/5 (36)
TABLE 2-15
The figure below is the ogive for the amount of fat (in grams) for a sample of 36 pizza products where the upper boundaries of the intervals are: 5, 10, 15, 20, 25, and 30.
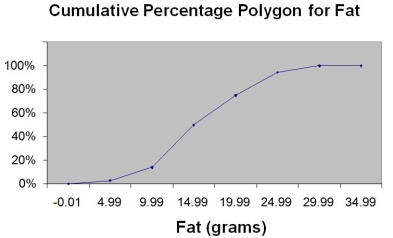 -Referring to Table 2-15, roughly what percentage of pizza products contain less than 10 grams of fat?
(Multiple Choice)
4.8/5 (29)
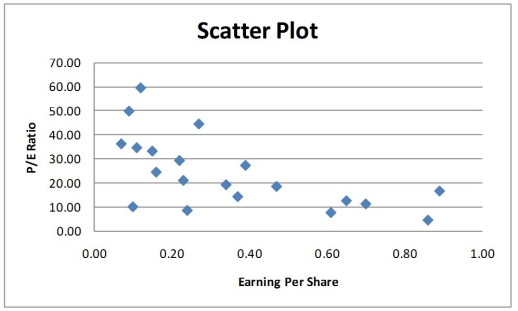
Given below is the scatter plot of the price/earnings ratio versus earnings per share of 20 U.S. companies. There appears to be a negative relationship between price/earnings ratio and earnings per share.
(True/False)
4.8/5 (42)
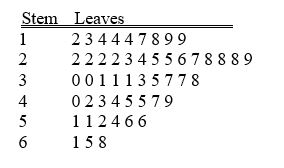
TABLE 2-18
The stem-and-leaf display below shows the result of a survey on 50 students on their satisfaction with their school with the higher scores represent higher level of satisfaction.
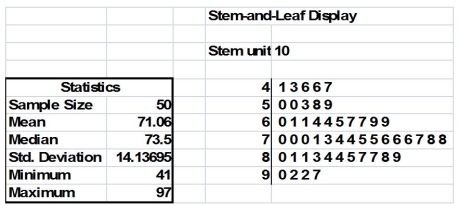 -Referring to Table 2-18, what was the lowest level of satisfaction?
(Short Answer)
4.7/5 (35)
TABLE 2-5
The following are the duration in minutes of a sample of long-distance phone calls made within the continental United States reported by one long-distance carrier.
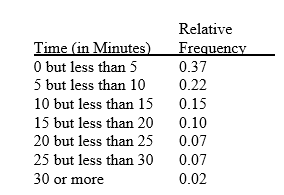 -Referring to Table 2-5, if 10 calls lasted 30 minutes or more, how many calls lasted less than 5 minutes?
(Multiple Choice)
4.7/5 (34)
TABLE 2-8
The stem-and-leaf display represents the number of times in a year that a random sample of 100 "lifetime" members of a health club actually visited the facility.
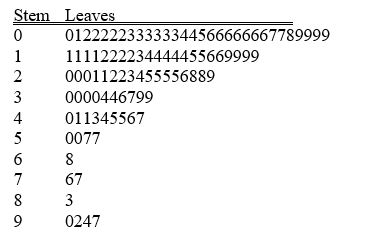 -Referring to Table 2-8, the person who has the largest leaf associated with the smallest stem visited the facility ________ times.
(Short Answer)
4.8/5 (34)
TABLE 2-9
The frequency distribution below represents the rents of 250 randomly selected federally subsidized apartments in a small town.
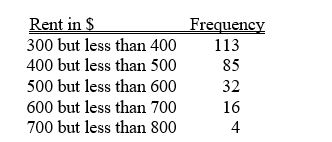 -Referring to Table 2-9, ________ percent of the apartments rented for at least $500.
(Short Answer)
4.9/5 (33)
TABLE 2-12
The table below contains the opinions of a sample of 200 people broken down by gender about the latest congressional plan to eliminate anti-trust exemptions for professional baseball.
-Referring to Table 2-12, if the sample is a good representation of the population, we can expect ________ percent of the population will be males.
(Short Answer)
4.8/5 (44)
Data on the number of part-time hours students at a public university worked in a week were collected. Which of the following is the best chart for presenting the information?
(Multiple Choice)
4.7/5 (36)
TABLE 2-7
The stem-and-leaf display below contains data on the number of months between the date a civil suit is filed and when the case is actually adjudicated for 50 cases heard in superior court.
 -Referring to Table 2-7, if a frequency distribution with equal sized classes was made from this data, and the first class was "10 but less than 20," the cumulative percentage of the second class would be ________.
(Short Answer)
4.8/5 (36)
TABLE 2-5
The following are the duration in minutes of a sample of long-distance phone calls made within the continental United States reported by one long-distance carrier.
-Referring to Table 2-5, what is the cumulative relative frequency for the percentage of calls that lasted 10 minutes or more?
(Multiple Choice)
4.8/5 (33)
Given below is the scatter plot of the number of employees and the total revenue ($millions)of 20 U.S. companies. Companies that have higher numbers of employees appear to also have higher total revenue.
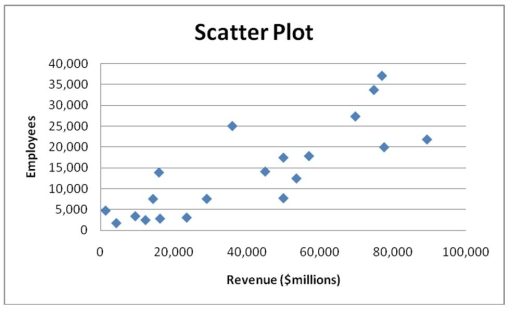
(True/False)
4.8/5 (37)
The sum of cumulative frequencies in a distribution always equals 1.
(True/False)
4.8/5 (24)
Filters
- Essay(0)
- Multiple Choice(0)
- Short Answer(0)
- True False(0)
- Matching(0)