Exam 1: Graphs and Models
Exam 1: Graphs and Models114 Questions
Exam 2: A Preview of Calculus92 Questions
Exam 3: The Derivative and the Tangent Line Problem191 Questions
Exam 4: Extrema on an Interval147 Questions
Exam 5: Antiderivatives and Indefinite Integration167 Questions
Exam 6: Slope Fields and Eulers Method85 Questions
Exam 7: Area of a Region Between Two Curves120 Questions
Exam 8: Basic Integration Rules127 Questions
Exam 9: Sequences179 Questions
Exam 10: Conics and Calculus120 Questions
Exam 11: Vectors in the Plane125 Questions
Exam 12: Vector-Valued Functions83 Questions
Exam 13: Introduction to Functions of Several Variables124 Questions
Exam 14: Iterated Integrals and Area in the Plane118 Questions
Exam 15: Vector Fields108 Questions
Exam 16: Exact First-Order Equations45 Questions
Select questions type
Find the coordinates of a second point on the graph of a function f if the given point is on the graph and the function is even.
(Multiple Choice)
4.8/5  (30)
(30)
Students in a lab measured the breaking strength S (in pounds) of wood 2 inches thick, inches high, and 12 inches long. The results are shown in the table below. Use the model to approximate the breaking strength when . Round your answer to two decimal places.
x 4 6 8 10 12 S 2382 5472 10,322 16,262 23,872
(Multiple Choice)
4.7/5 (28)
Write an equation of the line that passes through the given point and is perpendicular to the given line. Point Line (-1,-7) x=6
(Multiple Choice)
4.8/5 (31)
model , where is the diameter of the wire in mils ( in). Use a graphing utility to graph the model .
(Multiple Choice)
4.8/5 (37)
Match the graph of the function given below with the graph of its inverse function.
(Multiple Choice)
4.8/5 (35)
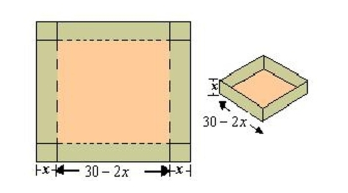
centimeters on a side by cutting equal squares from the corners and turning up the sides(see figure). What is the domain of the function .
(Multiple Choice)
4.8/5 (34)
an experiment, students measured the speed s (in meters per second) of a falling object seconds after it was released. The results are shown in the table below. Use the regression capabilities of a graphing utility to find a linear model for the data. Round all numerical values in your answer to one decimal place.
t 0 1 2 3 4 s 0 40 48.4 58.2 68.4
(Multiple Choice)
4.9/5 (35)
Filters
- Essay(0)
- Multiple Choice(0)
- Short Answer(0)
- True False(0)
- Matching(0)