Exam 2: Limits and Derivatives
Exam 1: Functions124 Questions
Exam 2: Limits and Derivatives213 Questions
Exam 3: Differentiation183 Questions
Exam 4: Applications of Derivatives159 Questions
Exam 5: Integration107 Questions
Exam 6: Applications of Definite Integrals115 Questions
Exam 7: Integrals and Transcendental Functions114 Questions
Exam 8: Techniques of Integration124 Questions
Exam 9: First-Order Differential Equations75 Questions
Exam 10: Infinite Sequences and Series155 Questions
Select questions type
Use the table of values of f to estimate the limit.
-
4.9 4.99 4.999 5.001 5.01 5.1 ()
(Multiple Choice)
4.7/5  (42)
(42)
Find the limit for the given function , the point , and the positive number . Then find a number such that, for all .
-
(Multiple Choice)
4.8/5 (33)
Use the table to estimate the rate of change of y at the specified value of x.
-x = 1.
0 0 0.2 0.02 0.4 0.08 0.6 0.18 0.8 0.32 1.0 0.5 1.2 0.72 1.4 0.98
(Multiple Choice)
4.7/5 (36)
Use the slopes of UQ, UR, US, and UT to estimate the rate of change of y at the specified value of x.
-x = 2.5 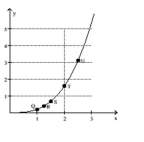
(Multiple Choice)
4.7/5 (34)
Prove the limit statement
-You are asked to make some circular cylinders, each with a cross-sectional area of . To do this, you need to know how much deviation from the ideal cylinder diameter of you can allow and still have the area come within of the required . To find out, let and look for the interval in which you must hold to make . What interval do you find?
(Multiple Choice)
4.7/5 (32)
Provide an appropriate response.
-Given , find an interval , such that if lies in , then . What limit is being verified and what is its value?
(Multiple Choice)
5.0/5 (32)
Provide an appropriate response.
-Write the formal notation for the principle "the limit of a quotient is the quotient of the limits" and include a statement of any restrictions on the principle.
(Multiple Choice)
4.8/5 (37)
The graph below shows the number of tuberculosis deaths in the United States from 1989 to 1998. 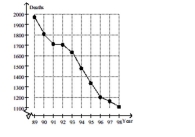 Estimate the average rate of change in tuberculosis deaths from 1993 to 1995.
(Multiple Choice)
4.9/5 (36)
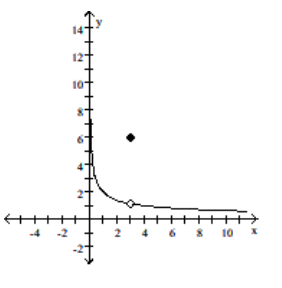
Use the graph to estimate the specified limit.
-Find lim x 0 f(x)
(Multiple Choice)
4.9/5 (37)
Use the table of values of f to estimate the limit.
- Let f(x)=, find f(x) x -0.1 -0.01 -0.001 0.001 0.01 0.1 f(x) 5.99640065 5.99640065
(Multiple Choice)
4.7/5 (47)
Prove the limit statement
-Select the correct statement for the definition of the limit: means that___________
(Multiple Choice)
4.9/5 (46)
Use a CAS to plot the function near the point x0 being approached. From your plot guess the value of the limit.
-
(Multiple Choice)
4.9/5 (40)
Filters
- Essay(0)
- Multiple Choice(0)
- Short Answer(0)
- True False(0)
- Matching(0)