Exam 2: Limits and Derivatives
Exam 1: Functions124 Questions
Exam 2: Limits and Derivatives213 Questions
Exam 3: Differentiation183 Questions
Exam 4: Applications of Derivatives159 Questions
Exam 5: Integration107 Questions
Exam 6: Applications of Definite Integrals115 Questions
Exam 7: Integrals and Transcendental Functions114 Questions
Exam 8: Techniques of Integration124 Questions
Exam 9: First-Order Differential Equations75 Questions
Exam 10: Infinite Sequences and Series155 Questions
Select questions type
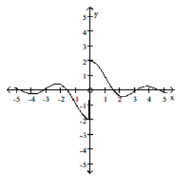
Use the graph to estimate the specified limit.
-Find lim x 0 f(x)
(Multiple Choice)
4.8/5  (30)
(30)
Find the limit for the given function , the point , and the positive number . Then find a number such that, for all .
-
(Multiple Choice)
4.8/5 (41)
Find the limit for the given function , the point , and the positive number . Then find a number such that, for all .
-f(x) = -10x + 5, L = -15, x0 = 2, and = 0.01
(Multiple Choice)
4.9/5 (38)
Find the limit for the given function , the point , and the positive number . Then find a number such that, for all .
-
(Multiple Choice)
4.8/5 (30)
Find the limit for the given function , the point , and the positive number . Then find a number such that, for all .
-f(x) = 3x - 2, L = 1, x0 = 1, and = 0.01
(Multiple Choice)
4.8/5 (38)
Use the table of values of f to estimate the limit.
-
1.9 1.99 1.999 2.001 2.01 2.1 ()
(Multiple Choice)
4.7/5 (34)
Provide an appropriate response.
-It can be shown that the inequalities hold for all values of close to zero. What, if anything, does this tell you about ? Explain.
(Essay)
4.9/5 (28)
Provide an appropriate response.
-If and is an odd function, which of the following statements are true?
I.
II.
III. does not exist.
(Multiple Choice)
4.9/5 (41)
Use the table to estimate the rate of change of y at the specified value of x.
-x = 2.
0 10 0.5 38 1.0 58 1.5 70 2.0 74 2.5 70 3.0 58 3.5 38 4.0 10
(Multiple Choice)
4.8/5 (40)
Use the table to estimate the rate of change of y at the specified value of x.
-When exposed to ethylene gas, green bananas will ripen at an accelerated rate. The number of days for ripening becomes shorter for longer exposure times. Assume that the table below gives average ripening times of
Bananas for several different ethylene exposure times. 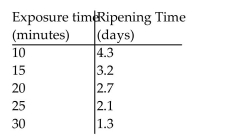 Plot the data and then find a line approximating the data. With the aid of this line, determine the rate of change of Ripening time with respect to exposure time. Round your answer to two significant digits.
(Multiple Choice)
4.8/5 (34)
Filters
- Essay(0)
- Multiple Choice(0)
- Short Answer(0)
- True False(0)
- Matching(0)