Exam 8: Analyzing Cells, Molecules, and Systems
Exam 1: Cells and Genomes34 Questions
Exam 2: Cell Chemistry and Bioenergetics54 Questions
Exam 3: Proteins52 Questions
Exam 4: DNA, Chromosomes, and Genomes57 Questions
Exam 5: DNA Replication, Repair, and Recombination51 Questions
Exam 6: How Cells Read the Genome: From DNA to Protein58 Questions
Exam 7: Control of Gene Expression62 Questions
Exam 8: Analyzing Cells, Molecules, and Systems95 Questions
Exam 9: Visualizing Cells29 Questions
Exam 10: Membrane Structure26 Questions
Exam 11: Membrane Transport of Small Molecules and the Electrical Properties of Membranes46 Questions
Exam 12: Intracellular Compartments and Protein Sorting46 Questions
Exam 13: Intracellular Membrane Traffic54 Questions
Exam 14: Energy Conversion: Mitochondria and Chloroplasts49 Questions
Exam 15: Cell Signaling63 Questions
Exam 16: The Cytoskeleton75 Questions
Exam 17: The Cell Cycle57 Questions
Exam 18: Cell Death12 Questions
Exam 19: Cell Junctions and the Extracellular Matrix56 Questions
Exam 20: Cancer50 Questions
Exam 21: Development of Multicellular Organisms61 Questions
Exam 22: Stem Cells and Tissue Renewal45 Questions
Exam 23: Pathogens and Infection32 Questions
Exam 24: The Innate and Adaptive Immune Systems47 Questions
Select questions type
The following schematic graph shows the result of two quantitative RT-PCR experiments. Total mRNA from two tissue samples (1 and 2) was isolated and subjected to RT-PCR using primers designed to amplify a tissue-specific gene. Added to the reaction was a fluorescent dye that fluoresces only when bound to double-stranded DNA. According to the graph, which tissue has a higher level of this mRNA? By how much? 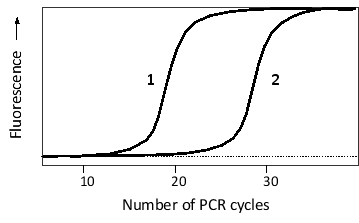
(Multiple Choice)
4.9/5  (39)
(39)
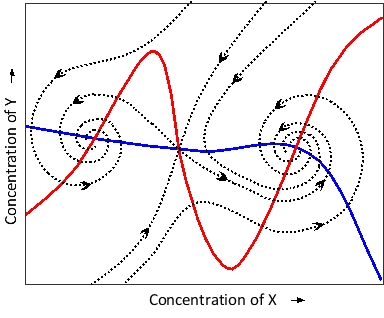
The schematic graph below represents the nullclines (solid curves) and a few selected trajectories (dotted curves) for a system composed of two proteins (X and Y) with a complex regulatory behavior. According to the graph, indicate whether each of the following statements is (Y) or is not (N) acceptable. Your answer would be a four-letter string composed of letters Y and N only, e.g. YYYY.
 ( ) The system is bistable.
( ) There are three steady states in the system.
( ) The system contains positive feedback.
( ) The system contains delayed negative feedback.
( ) The system is bistable.
( ) There are three steady states in the system.
( ) The system contains positive feedback.
( ) The system contains delayed negative feedback.
(Short Answer)
4.8/5 (37)
For a complementation test to work, the mutations under study must be…
(Multiple Choice)
4.7/5 (41)
The results of two sets of chromatin immunoprecipitation experiments on two cell types (1 and 2) are shown in the following simplified graphs for the same genomic region containing the first two exons of a gene. Antibodies against a transcription regulatory protein (X) or against a subunit of RNA polymerase II were used in the ChIP-seq experiments, as indicated. Do you think the protein is a transcriptional activator or repressor? The results from a parallel RNA-seq experiment are provided in the third graph. Which profile (a or b) in the graph would you expect to correspond to cell type 1? 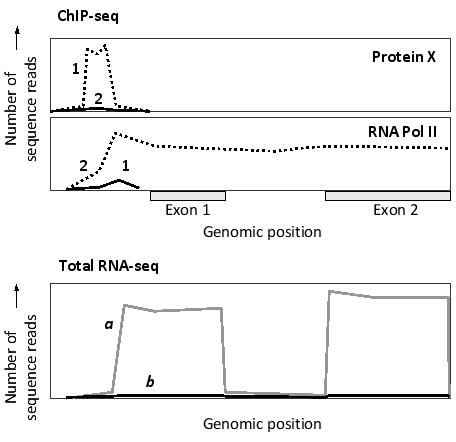
(Multiple Choice)
4.7/5 (36)
A piece of DNA has been sequenced by automated dideoxy sequencing, in which each dideoxyribonucleoside triphosphate was labeled with a fluorescent tag of a different color. The data corresponding to a small segment with the sequence 5′-TGCCACA-3′ is shown in the following diagram. Knowing that ddGTP has been labeled with green fluorescence, what color do you think was the fluorescent tag used to label ddTTP in the sequencing experiment? 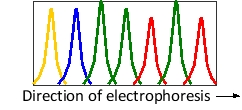
(Multiple Choice)
4.8/5 (42)
Sort the following cellular components to reflect the centrifugal force required to sediment them by preparative ultracentrifugation, from low to high force required. Your answer would be a four-letter string composed of letters R, M, L, and N, e.g. LRNM.
(L) Lysosomes
(M) Microsomes
(N) Nuclei
(R) Ribosomes (free cytosolic)
(Short Answer)
4.7/5 (31)
In purifying proteins by column chromatography, elution can be performed in different ways, depending on the type of matrix. For example, bound proteins can be eluted by gradually increasing or decreasing salt concentration in the solution applied to the column. For which of the following matrices do you think increasing and decreasing salt concentration, respectively, are used for elution?
(Multiple Choice)
4.7/5 (42)
RNA-seq and ribosome profiling experiments have been carried out on the same cells. The following simplified graphs show the results for the same genomic region containing a gene with three exons. Which graph (1 or 2) do you think corresponds to the RNA-seq results? What feature is represented by the arrow? 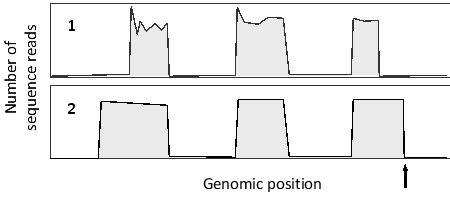
(Multiple Choice)
4.8/5 (41)
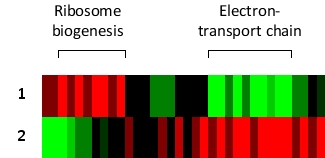
You have grown cultures of the yeast Saccharomyces cerevisiae in a complex medium alone or supplemented with either glucose or ethanol. In the presence of glucose, available energy is abundant and the cells can therefore grow by fermenting glucose. In the presence of ethanol, however, the cells switch to a mostly aerobic respiration to meet their energy demands. They also shut down many of their anabolic pathways and activate catabolic pathways to produce more energy to better survive under these conditions. After the growth phase, you extract total mRNA from the cells, convert them to cDNA, and label them with a fluorescent molecule. You then hybridize the cDNAs to a yeast DNA microarray. Part of the results obtained by cluster analysis after fluorescent measurements is summarized in the following simplified diagram. Here, red and green indicate increase and decrease, respectively, in expression of a gene compared to that in the nonsupplemented medium. Which row (1 or 2) do you think corresponds to the glucose-supplemented medium?
(Short Answer)
4.9/5 (34)
In an unfolded (random coil) protein, amino acid residues are exposed to the solvent and share more or less the same environment, whereas each residue in a folded protein has its own unique neighborhood. This fact can be exploited in using NMR to study protein folding. The two schematic diagrams below represent two-dimensional NMR spectra for the same protein in either its folded (native) or unfolded state. The chemical shifts, which depend on the local neighborhood of each atom, are plotted in these diagrams. Which diagram (A or B) do you think corresponds to the folded protein?
(Multiple Choice)
4.8/5 (40)
Some feed-forward motifs are capable of generating a brief pulse of gene activation in response to a sustained input signal: in such motifs, the signal activates an activator (A) and a repressor (R), both of which control the expression of the same gene. The quantitative output of the gene depends in part on the relative affinities of A and R for binding to the cis-regulatory sequences of the target gene. Under which of the following conditions is a brief pulse of gene activation observed in response to a sustained input signal? KA and KR are the association constants for A and R, respectively.
(Multiple Choice)
4.9/5 (46)
There are six possible reading frames for any double-stranded DNA. In the following schematic drawing of a genomic region in Escherichia coli, stop codons in each of these frames are indicated by black bars. In which reading frame do you think the open reading frame (ORF) is translated in this region? Write down the frame number as your answer, e.g. 2.
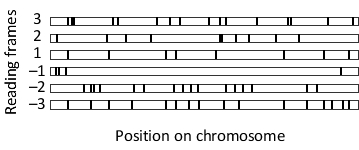
(Short Answer)
4.8/5 (44)
In the following schematic graph, the fraction of promoters (px) bound to the regulatory protein A is plotted at various concentrations of A. Which of the following quantities represents X in the graph? 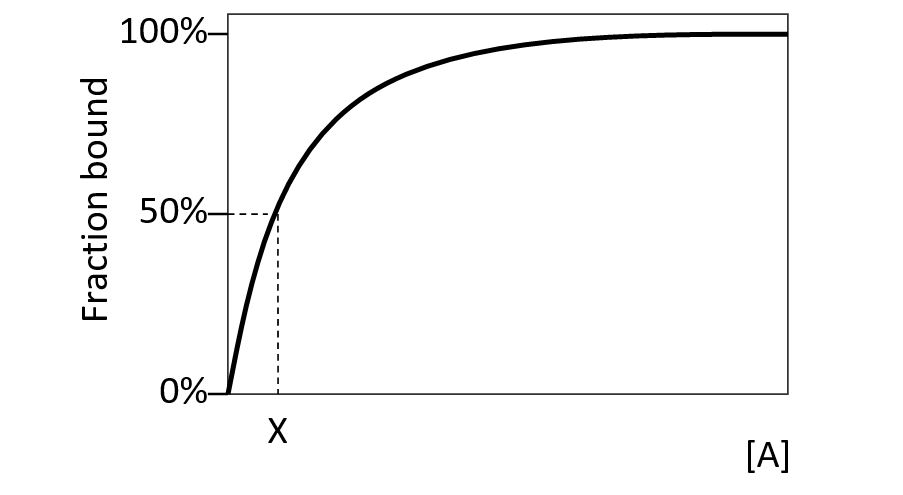
(Multiple Choice)
4.8/5 (32)
A protein made from an expression vector can be so plentiful as to account for about 10% of total cell protein. You would like to produce a protein of interest that can be expressed at such a level in Escherichia coli. You plan to induce the expression and collect the cells when cell density in the culture medium reaches about 10? cells/mL. Proteins make up about 15% of total cell weight, and each E. coli cell typically has a mass of about 1 picogram (i.e. 10-¹² g). Assuming that almost 50% of the protein is lost during purification, how many liters of culture should you prepare in order to obtain 15 milligrams of pure protein? Write down your answer in liters, with two decimal places and without units, e.g. 15.00.
(Short Answer)
5.0/5 (37)
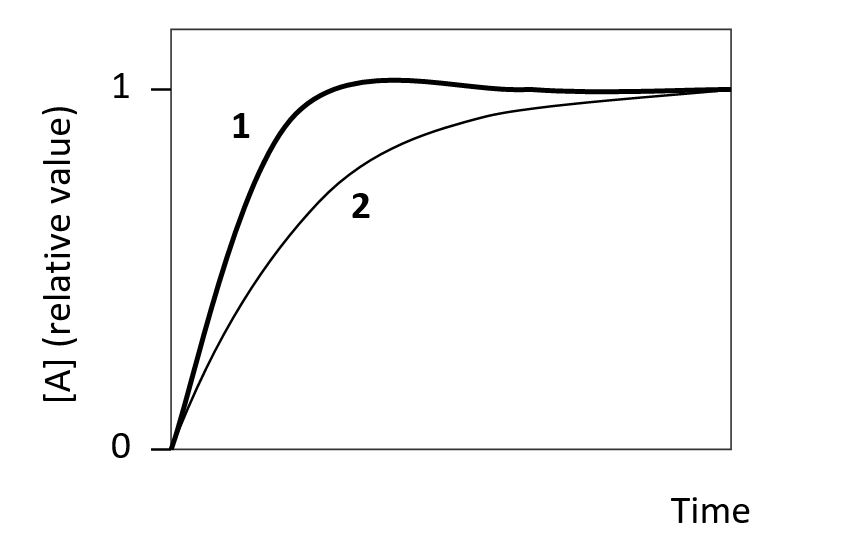
The following graph shows the change in the concentration of a protein (A) over time as a fraction of the final steady-state level. The two curves (1 and 2) in the graph are simulations with similar parameters except that one of them involves a negative feedback loop in which A activates the expression of a repressor protein which in turn represses the expression of A. Which curve (1 or 2) corresponds to the simulation with the negative feedback loop? Write down 1 or 2 as your answer.
(Short Answer)
4.8/5 (36)
Filters
- Essay(0)
- Multiple Choice(0)
- Short Answer(0)
- True False(0)
- Matching(0)