Exam 2: Organizing and Visualizing Variables
Exam 1: Defining and Collecting Data207 Questions
Exam 2: Organizing and Visualizing Variables213 Questions
Exam 3: Numerical Descriptive Measures167 Questions
Exam 4: Basic Probability171 Questions
Exam 5: Discrete Probability Distributions217 Questions
Exam 6: The Normal Distributions and Other Continuous Distributions189 Questions
Exam 7: Sampling Distributions135 Questions
Exam 8: Confidence Interval Estimation189 Questions
Exam 9: Fundamentals of Hypothesis Testing: One-Sample Tests187 Questions
Exam 10: Two-Sample Tests208 Questions
Exam 11: Analysis of Variance216 Questions
Exam 12: Chi-Square and Nonparametric Tests178 Questions
Exam 13: Simple Linear Regression214 Questions
Exam 14: Introduction to Multiple Regression336 Questions
Exam 15: Multiple Regression Model Building99 Questions
Exam 16: Time-Series Forecasting173 Questions
Exam 17: Business Analytics115 Questions
Exam 18: A Roadmap for Analyzing Data329 Questions
Exam 19: Statistical Applications in Quality Management Online162 Questions
Exam 20: Decision Making Online129 Questions
Exam 21: Understanding Statistics: Descriptive and Inferential Techniques39 Questions
Select questions type
Data on the number of credit hours of 20,000 students at a public university enrolled in a Spring semester were collected.Which of the following is the best for presenting the information?
(Multiple Choice)
4.8/5  (39)
(39)
SCENARIO 2-10 The histogram below represents scores achieved by 200 job applicants on a personality profile. 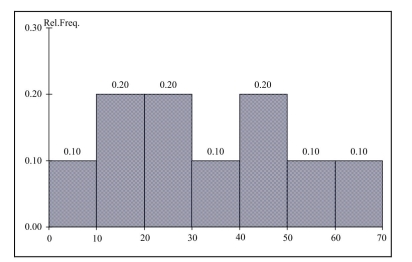 -Referring to the histogram from Scenario 2-10, half of the job applicants scored below ________.
(Short Answer)
5.0/5 (34)
A multidimensional contingency table allows you to tally the responses of more than two categorical variables.
(True/False)
4.9/5 (34)
The sum of cumulative frequencies in a distribution always equals 1.
(True/False)
4.8/5 (28)
SCENARIO 2-13 Given below is the stem-and-leaf display representing the amount of detergent used in gallons (with leaves in 10ths of gallons)in a day by 25 drive-through car wash operations in Phoenix. 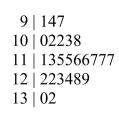 -Referring to Scenario 2-13, construct a percentage polygon for the detergent data if the corresponding frequency distribution uses "9.0 but less than 10.0" as the first class.
(Essay)
4.9/5 (32)
SCENARIO 2-18 The stem-and-leaf display below shows the result of a survey on 50 students on their satisfaction with their school with the higher scores represent higher level of satisfaction. 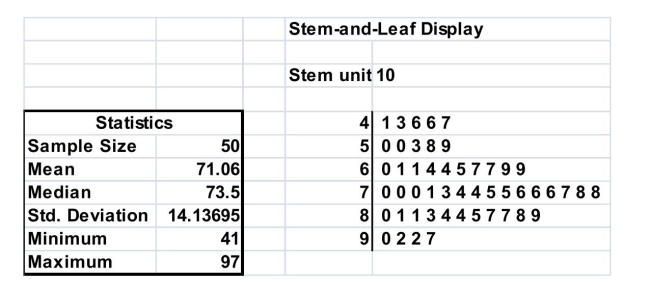 -Referring to Scenario 2-18, if a student is randomly selected, his/her most likely level of satisfaction will be in the 60s among the
  and 90s.
(True/False)
4.8/5 (40)
SCENARIO 2-5 The following are the duration in minutes of a sample of long-distance phone calls made within the continental United States reported by one long-distance carrier. 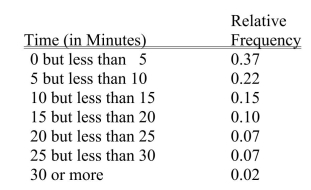 -Referring to Scenario 2-5, if 10 calls lasted 30 minutes or more, how many calls lasted less than 5 minutes?
(Multiple Choice)
4.8/5 (26)
Determining the class boundaries of a frequency distribution is highly subjective.
(True/False)
4.7/5 (41)
In general, a frequency distribution should have at least 8 class groups but no more than 20.
(True/False)
4.8/5 (34)
SCENARIO 2-12 The table below contains the opinions of a sample of 200 people broken down by gender about the latest congressional plan to eliminate anti-trust exemptions for professional baseball. 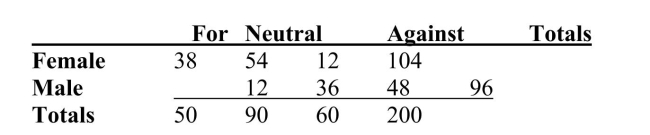 -Referring to Scenario 2-12, if the sample is a good representation of the population, we can expect _______ percent of the males in the population will be against the plan.
(Short Answer)
4.8/5 (28)
SCENARIO 2-4 A survey was conducted to determine how people rated the quality of programming available on television.Respondents were asked to rate the overall quality from 0 (no quality at all)to 100 (extremely good quality).The stem-and-leaf display of the data is shown below. 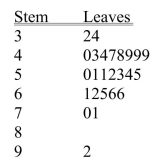 -Referring to Scenario 2-4, what percentage of the respondents rated overall television quality with a rating of 50 or below?
(Multiple Choice)
4.9/5 (44)
In graphing two categorical data, the side-by-side bar chart is best suited when comparing joint responses.
(True/False)
4.8/5 (36)
SCENARIO 2-12 The table below contains the opinions of a sample of 200 people broken down by gender about the latest congressional plan to eliminate anti-trust exemptions for professional baseball.
-Referring to Scenario 2-12, ________ percent of the 200 were males who were neutral.
(Short Answer)
5.0/5 (30)
The Guidelines for Developing Visualizations recommend using varying scale to conserve precious space whenever possible.
(True/False)
4.8/5 (42)
When constructing a frequency distribution, classes should be selected so that they are of equal width.
(True/False)
4.9/5 (31)
When constructing charts, the following is plotted at the class midpoints:
(Multiple Choice)
4.7/5 (34)
SCENARIO 2-18 The stem-and-leaf display below shows the result of a survey on 50 students on their satisfaction with their school with the higher scores represent higher level of satisfaction.
-Referring to Scenario 2-18, the level of satisfaction is concentrated around 75.
(True/False)
4.7/5 (41)
SCENARIO 2-9 The frequency distribution below represents the rents of 250 randomly selected federally subsidized apartments in a small town. 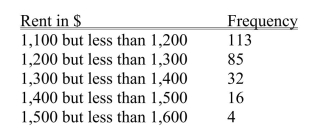 -Referring to Scenario 2-9, the relative frequency of the second class is ________.
(Short Answer)
4.8/5 (41)
SCENARIO 2-2 At a meeting of information systems officers for regional offices of a national company, a survey was taken to determine the number of employees the officers supervise in the operation of their departments, where X is the number of employees overseen by each information systems officer and f is the number of officers for each X. 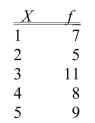 -Referring to Scenario 2-2, across all the regional offices, how many total employees were supervised by those surveyed?
(Multiple Choice)
4.8/5 (37)
The Guidelines for Developing Visualizations recommend avoiding uncommon chart type such as doughnut, radar, cone and pyramid charts.
(True/False)
4.8/5 (34)
Filters
- Essay(0)
- Multiple Choice(0)
- Short Answer(0)
- True False(0)
- Matching(0)