Exam 2: Organizing and Visualizing Variables
Exam 1: Defining and Collecting Data207 Questions
Exam 2: Organizing and Visualizing Variables213 Questions
Exam 3: Numerical Descriptive Measures167 Questions
Exam 4: Basic Probability171 Questions
Exam 5: Discrete Probability Distributions217 Questions
Exam 6: The Normal Distributions and Other Continuous Distributions189 Questions
Exam 7: Sampling Distributions135 Questions
Exam 8: Confidence Interval Estimation189 Questions
Exam 9: Fundamentals of Hypothesis Testing: One-Sample Tests187 Questions
Exam 10: Two-Sample Tests208 Questions
Exam 11: Analysis of Variance216 Questions
Exam 12: Chi-Square and Nonparametric Tests178 Questions
Exam 13: Simple Linear Regression214 Questions
Exam 14: Introduction to Multiple Regression336 Questions
Exam 15: Multiple Regression Model Building99 Questions
Exam 16: Time-Series Forecasting173 Questions
Exam 17: Business Analytics115 Questions
Exam 18: A Roadmap for Analyzing Data329 Questions
Exam 19: Statistical Applications in Quality Management Online162 Questions
Exam 20: Decision Making Online129 Questions
Exam 21: Understanding Statistics: Descriptive and Inferential Techniques39 Questions
Select questions type
Given below is the scatter plot of the market value (thousands$)and profit (thousands$)of 50 U.S.companies.There appears to be a negative relationship between market value and profit. 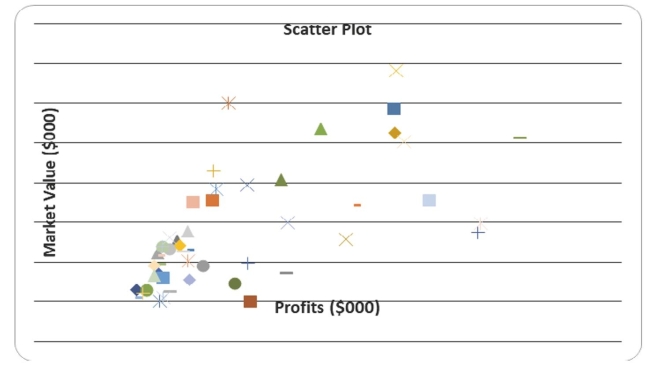
(True/False)
4.9/5  (25)
(25)
SCENARIO 2-10 The histogram below represents scores achieved by 200 job applicants on a personality profile. 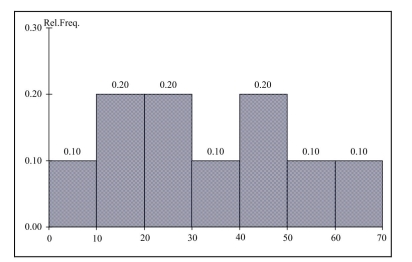 -Referring to the histogram from Scenario 2-10, 90% of the job applicants scored above or equal to ________.
(Short Answer)
4.9/5 (28)
SCENARIO 2-17 The following table presents total retail sales in millions of dollars for the leading apparel companies over a two-year period in the past. 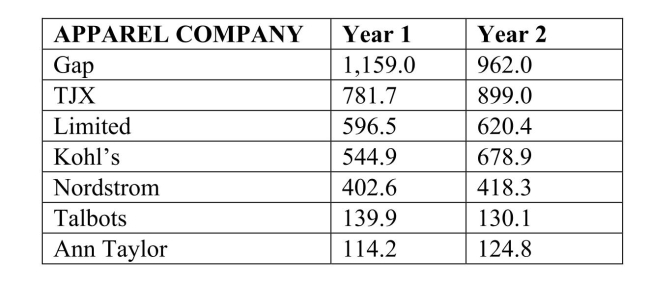 -Referring to Scenario 2-17, among the 8 stores, _______ saw a sales decline.
(Short Answer)
4.8/5 (33)
SCENARIO 2-11 The ordered array below resulted from selecting a sample of 25 batches of 500 computer chips and determining how many in each batch were defective. 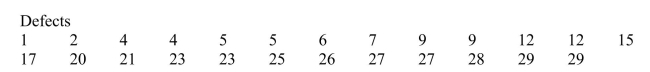 -Referring to Scenario 2-11, construct a cumulative percentage distribution for the defects data if the corresponding frequency distribution uses "0 but less than 5" as the first class.
(Essay)
4.9/5 (36)
SCENARIO 2-5 The following are the duration in minutes of a sample of long-distance phone calls made within the continental United States reported by one long-distance carrier. 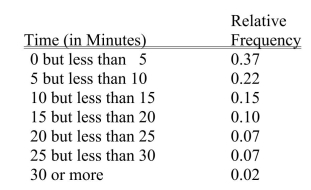 -Referring to Scenario 2-5, what is the cumulative relative frequency for the percentage of calls that lasted 10 minutes or more?
(Multiple Choice)
4.8/5 (28)
The percentage polygon is formed by having the lower boundary of each class represent the data in that class and then connecting the sequence of lower boundaries at their respective class percentages.
(True/False)
4.8/5 (22)
SCENARIO 2-9 The frequency distribution below represents the rents of 250 randomly selected federally subsidized apartments in a small town. 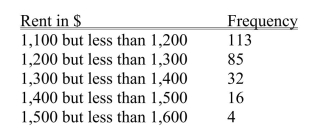 -Referring to Scenario 2-9, the percentage of apartments renting for less than $1,400 is ________.
(Short Answer)
4.8/5 (30)
SCENARIO 2-10 The histogram below represents scores achieved by 200 job applicants on a personality profile.
-Referring to the histogram from Scenario 2-10, the number of job applicants who scored between 30 and below 60 is _______.
(Short Answer)
4.9/5 (39)
Histograms are used for numerical data while bar charts are suitable for categorical data.
(True/False)
4.9/5 (27)
SCENARIO 2-14 The table below contains the number of people who own a portable Blu-ray player in a sample of 600 broken down by gender. 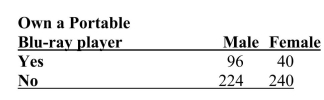 -Referring to Scenario 2-14 of the females in the sample, ________ percent owned a portable Blu-ray player.
(Short Answer)
4.7/5 (39)
SCENARIO 2-12 The table below contains the opinions of a sample of 200 people broken down by gender about the latest congressional plan to eliminate anti-trust exemptions for professional baseball. 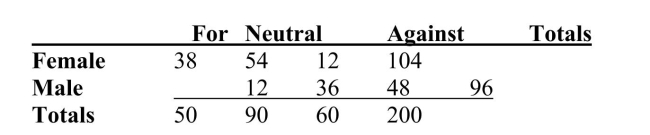 -Referring to Scenario 2-12, construct a table of total percentages.
(Essay)
4.7/5 (29)
SCENARIO 2-8 The Stem-and-Leaf display represents the number of times in a year that a random sample of 100 "lifetime" members of a health club actually visited the facility. 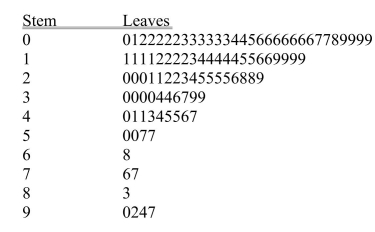 -Referring to Scenario 2-8, if a frequency distribution with equal sized classes was made from this data, and the first class was "0 but less than 10," the class midpoint of the third class would be ________.
(Short Answer)
4.9/5 (34)
SCENARIO 2-14 The table below contains the number of people who own a portable Blu-ray player in a sample of 600 broken down by gender.
-Referring to Scenario 2-14, ________ percent of the 600 were females.
(Short Answer)
4.8/5 (27)
SCENARIO 2-12 The table below contains the opinions of a sample of 200 people broken down by gender about the latest congressional plan to eliminate anti-trust exemptions for professional baseball.
-Referring to Scenario 2-12, ________ percent of the 200 were males.
(Short Answer)
4.8/5 (45)
A good choice for the number of class groups to use in constructing frequency distribution is to have at least 5 but no more than 15 class groups.
(True/False)
4.9/5 (43)
SCENARIO 2-6 A sample of 200 students at a Big-Ten university was taken after the midterm to ask them whether they went bar hopping the weekend before the midterm or spent the weekend studying, and whether they did well or poorly on the midterm.The following table contains the result. 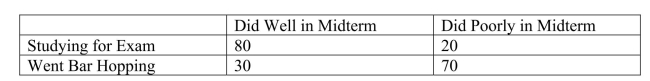 -Referring to Scenario 2-6, if the sample is a good representation of the population, we can expect _______ percent of those who did poorly on the midterm to have spent the weekend studying.
(Multiple Choice)
4.8/5 (34)
SCENARIO 2-5 The following are the duration in minutes of a sample of long-distance phone calls made within the continental United States reported by one long-distance carrier.
-Referring to Scenario 2-5, if 100 calls were sampled, _______ of them would have lasted less than 5 minutes or at least 30 minutes or more.
(Multiple Choice)
4.7/5 (27)
SCENARIO 2-6 A sample of 200 students at a Big-Ten university was taken after the midterm to ask them whether they went bar hopping the weekend before the midterm or spent the weekend studying, and whether they did well or poorly on the midterm.The following table contains the result.
-Referring to Scenario 2-6, of those who did well on the midterm in the sample, _______ percent of them went bar hopping the weekend before the midterm.
(Multiple Choice)
4.8/5 (39)
Given below is the scatter plot of the price/earnings ratio versus earnings per share of 20 U.S.companies.There appears to be a negative relationship between price/earnings ratio and earnings per share. 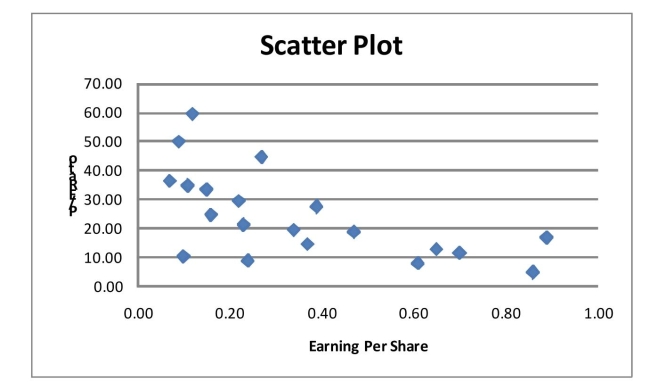
(True/False)
4.9/5 (36)
SCENARIO 2-11 The ordered array below resulted from selecting a sample of 25 batches of 500 computer chips and determining how many in each batch were defective.
-Referring to Scenario 2-11, construct a cumulative percentage polygon for the defects data if the corresponding frequency distribution uses "0 but less than 5" as the first class.
(Essay)
4.8/5 (31)
Filters
- Essay(0)
- Multiple Choice(0)
- Short Answer(0)
- True False(0)
- Matching(0)