Exam 2: Organizing and Visualizing Variables
Exam 1: Defining and Collecting Data207 Questions
Exam 2: Organizing and Visualizing Variables213 Questions
Exam 3: Numerical Descriptive Measures167 Questions
Exam 4: Basic Probability171 Questions
Exam 5: Discrete Probability Distributions217 Questions
Exam 6: The Normal Distributions and Other Continuous Distributions189 Questions
Exam 7: Sampling Distributions135 Questions
Exam 8: Confidence Interval Estimation189 Questions
Exam 9: Fundamentals of Hypothesis Testing: One-Sample Tests187 Questions
Exam 10: Two-Sample Tests208 Questions
Exam 11: Analysis of Variance216 Questions
Exam 12: Chi-Square and Nonparametric Tests178 Questions
Exam 13: Simple Linear Regression214 Questions
Exam 14: Introduction to Multiple Regression336 Questions
Exam 15: Multiple Regression Model Building99 Questions
Exam 16: Time-Series Forecasting173 Questions
Exam 17: Business Analytics115 Questions
Exam 18: A Roadmap for Analyzing Data329 Questions
Exam 19: Statistical Applications in Quality Management Online162 Questions
Exam 20: Decision Making Online129 Questions
Exam 21: Understanding Statistics: Descriptive and Inferential Techniques39 Questions
Select questions type
The larger the number of observations in a numerical data set, the larger the number of class intervals needed for a grouped frequency distribution.
(True/False)
4.8/5  (33)
(33)
To determine the width of class interval, divide the number of class groups by the range of the data.
(True/False)
4.7/5 (33)
SCENARIO 2-13 Given below is the stem-and-leaf display representing the amount of detergent used in gallons (with leaves in 10ths of gallons)in a day by 25 drive-through car wash operations in Phoenix. 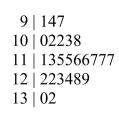 -Referring to Scenario 2-13, construct a cumulative percentage polygon for the detergent data if the corresponding frequency distribution uses "9.0 but less than 10.0" as the first class.
(Essay)
4.7/5 (36)
One of the advantages of a pie chart is that it clearly shows that the total of all the categories of the pie adds to 100%.
(True/False)
4.7/5 (42)
Percentage polygons are plotted at the boundaries of the class groupings.
(True/False)
4.9/5 (32)
SCENARIO 2-13 Given below is the stem-and-leaf display representing the amount of detergent used in gallons (with leaves in 10ths of gallons)in a day by 25 drive-through car wash operations in Phoenix.
-Referring to Scenario 2-13, construct a relative frequency or percentage distribution for the detergent data, using "9.0 but less than 10.0" as the first class.
(Essay)
4.9/5 (29)
SCENARIO 2-14 The table below contains the number of people who own a portable Blu-ray player in a sample of 600 broken down by gender. 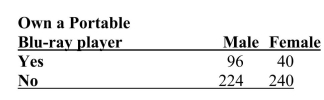 -Referring to Scenario 2-14, _______ percent of the 600 were males who did not own a portable Blu-ray player.
(Short Answer)
4.9/5 (38)
SCENARIO 2-5 The following are the duration in minutes of a sample of long-distance phone calls made within the continental United States reported by one long-distance carrier. 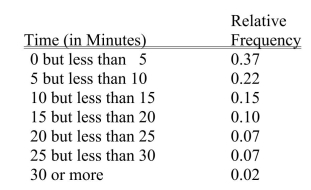 -Referring to Scenario 2-5, if 100 calls were sampled, _______of them would have lasted 20 minutes or more.
(Multiple Choice)
4.9/5 (36)
The relative frequency is the frequency in each class divided by the total number of observations.
(True/False)
4.8/5 (30)
SCENARIO 2-7 The Stem-and-Leaf display below contains data on the number of months between the date a civil suit is filed and when the case is actually adjudicated for 50 cases heard in superior court. 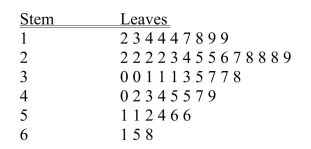 -Referring to Scenario 2-7, the civil suit with the fourth shortest waiting time between when the suit was filed and when it was adjudicated had a wait of ________ months.
(Short Answer)
5.0/5 (29)
You have collected data on the number of U.S.households actively using online banking and/or online bill payment over a 10-year period.Which of the following is the best for presenting the data?
(Multiple Choice)
4.7/5 (35)
SCENARIO 2-13 Given below is the stem-and-leaf display representing the amount of detergent used in gallons (with leaves in 10ths of gallons)in a day by 25 drive-through car wash operations in Phoenix.
-Referring to Scenario 2-13, if a percentage histogram for the detergent data is constructed, using "9.0 but less than 10.0 gallons" as the first class, what percentage of drive-through car wash operations use less than 12 gallons of detergent in a day?
(Short Answer)
4.9/5 (30)
SCENARIO 2-8 The Stem-and-Leaf display represents the number of times in a year that a random sample of 100 "lifetime" members of a health club actually visited the facility. 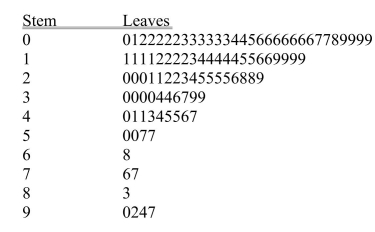 -Referring to Scenario 2-8, ________ of the 100 members visited the health club at least 52 times in a year.
(Short Answer)
4.8/5 (33)
You have collected data on the responses to two questions asked in a survey of 40 college students majoring in business-What is your gender (Male = M; Female = F)and What is your major (Accountancy = A; Computer Information Systems = C; Marketing = M). Which of the following is the best for presenting the data?
(Multiple Choice)
4.8/5 (29)
Data on 1,500 students' height were collected at a larger university in the East Coast. Which of the following is the best chart for presenting the information?
(Multiple Choice)
4.8/5 (38)
SCENARIO 2-8 The Stem-and-Leaf display represents the number of times in a year that a random sample of 100 "lifetime" members of a health club actually visited the facility.
-Referring to Scenario 2-8, if a frequency distribution with equal sized classes was made from this data, and the first class was "0 but less than 10," the relative frequency of the last class would be ________.
(Short Answer)
4.9/5 (39)
SCENARIO 2-18 The stem-and-leaf display below shows the result of a survey on 50 students on their satisfaction with their school with the higher scores represent higher level of satisfaction. 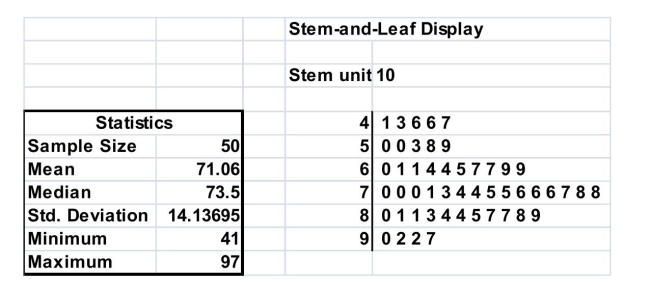 -Referring to Scenario 2-18, how many students have a satisfaction level below 60?
(Short Answer)
4.9/5 (35)
A side-by-side bar chart is two histograms plotted side-by-side.
(True/False)
4.8/5 (44)
SCENARIO 2-17 The following table presents total retail sales in millions of dollars for the leading apparel companies over a two-year period in the past. 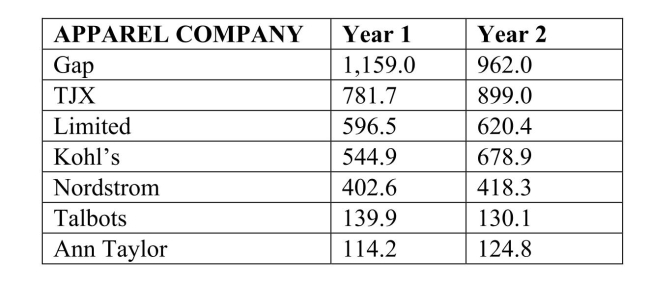 -Referring to Scenario 2-17, construct a side-by-side bar chart.
(Essay)
4.9/5 (30)
SCENARIO 2-7 The Stem-and-Leaf display below contains data on the number of months between the date a civil suit is filed and when the case is actually adjudicated for 50 cases heard in superior court.
-Referring to Scenario 2-7, ________ percent of the cases were not adjudicated within the first 4 years.
(Short Answer)
4.8/5 (44)
Filters
- Essay(0)
- Multiple Choice(0)
- Short Answer(0)
- True False(0)
- Matching(0)