Exam 2: Organizing and Visualizing Variables
Exam 1: Defining and Collecting Data207 Questions
Exam 2: Organizing and Visualizing Variables213 Questions
Exam 3: Numerical Descriptive Measures167 Questions
Exam 4: Basic Probability171 Questions
Exam 5: Discrete Probability Distributions217 Questions
Exam 6: The Normal Distributions and Other Continuous Distributions189 Questions
Exam 7: Sampling Distributions135 Questions
Exam 8: Confidence Interval Estimation189 Questions
Exam 9: Fundamentals of Hypothesis Testing: One-Sample Tests187 Questions
Exam 10: Two-Sample Tests208 Questions
Exam 11: Analysis of Variance216 Questions
Exam 12: Chi-Square and Nonparametric Tests178 Questions
Exam 13: Simple Linear Regression214 Questions
Exam 14: Introduction to Multiple Regression336 Questions
Exam 15: Multiple Regression Model Building99 Questions
Exam 16: Time-Series Forecasting173 Questions
Exam 17: Business Analytics115 Questions
Exam 18: A Roadmap for Analyzing Data329 Questions
Exam 19: Statistical Applications in Quality Management Online162 Questions
Exam 20: Decision Making Online129 Questions
Exam 21: Understanding Statistics: Descriptive and Inferential Techniques39 Questions
Select questions type
SCENARIO 2-12 The table below contains the opinions of a sample of 200 people broken down by gender about the latest congressional plan to eliminate anti-trust exemptions for professional baseball. 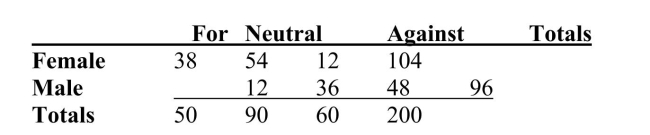 -Referring to Scenario 2-12, of the males in the sample, ________ percent were for the plan.
(Short Answer)
4.8/5  (40)
(40)
The Guidelines for Developing Visualizations recommend always including a scale for each axis if the chart contains axes.
(True/False)
4.9/5 (40)
SCENARIO 2-9 The frequency distribution below represents the rents of 250 randomly selected federally subsidized apartments in a small town. 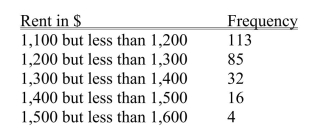 -Referring to Scenario 2-9, ________ percent of the apartments rented for $1,400 or more.
(Short Answer)
4.9/5 (37)
A _______ is a vertical bar chart in which the rectangular bars are constructed at the boundaries of each class interval.
(Short Answer)
4.8/5 (38)
SCENARIO 2-18 The stem-and-leaf display below shows the result of a survey on 50 students on their satisfaction with their school with the higher scores represent higher level of satisfaction. 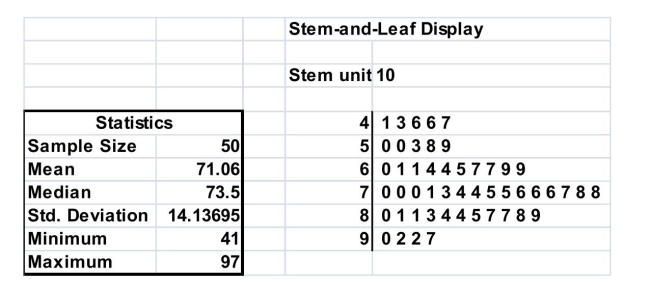 -Referring to Scenario 2-18, what was the highest level of satisfaction?
(Short Answer)
5.0/5 (26)
SCENARIO 2-14 The table below contains the number of people who own a portable Blu-ray player in a sample of 600 broken down by gender. 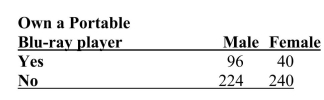 -Referring to Scenario 2-14, construct a table of total percentages.
(Essay)
4.8/5 (35)
SCENARIO 2-7 The Stem-and-Leaf display below contains data on the number of months between the date a civil suit is filed and when the case is actually adjudicated for 50 cases heard in superior court. 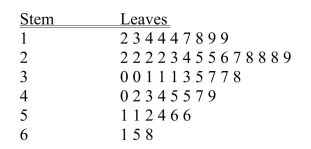 -Referring to Scenario 2-7, if a frequency distribution with equal sized classes was made from this data, and the first class was "10 but less than 20," the frequency of that class would be ________.
(Short Answer)
4.8/5 (34)
SCENARIO 2-17 The following table presents total retail sales in millions of dollars for the leading apparel companies over a two-year period in the past. 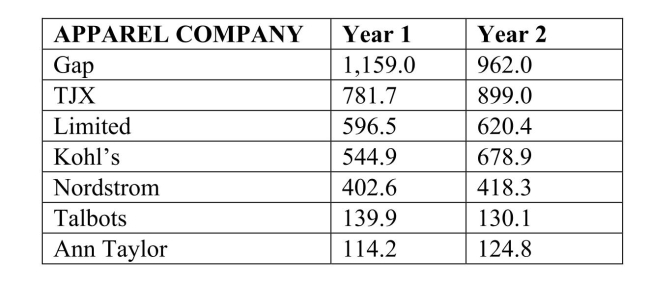 -Referring to Scenario 2-17, in general, retail sales for the apparel industry have seen a modest growth between Year 1 and Year 2.
(True/False)
4.9/5 (37)
The main principle behind the Pareto chart is the ability to separate the "vital few" from the "trivial many."
(True/False)
4.8/5 (35)
SCENARIO 2-14 The table below contains the number of people who own a portable Blu-ray player in a sample of 600 broken down by gender.
-Referring to Scenario 2-14, of the females in the sample, ________ percent did not own a portable Blu-ray player.
(Short Answer)
4.8/5 (28)
The width of each class grouping or interval in a frequency distribution should be ________.
(Short Answer)
4.8/5 (25)
SCENARIO 2-3 Every spring semester, the School of Business coordinates a luncheon with local business leaders for graduating seniors, their families, and friends.Corporate sponsorship pays for the lunches of each of the seniors, but students must purchase tickets to cover the cost of lunches served to guests they bring with them.The following histogram represents the attendance at the senior luncheon, where X is the number of guests each graduating senior invited to the luncheon and  is the number of graduating seniors in each category.
 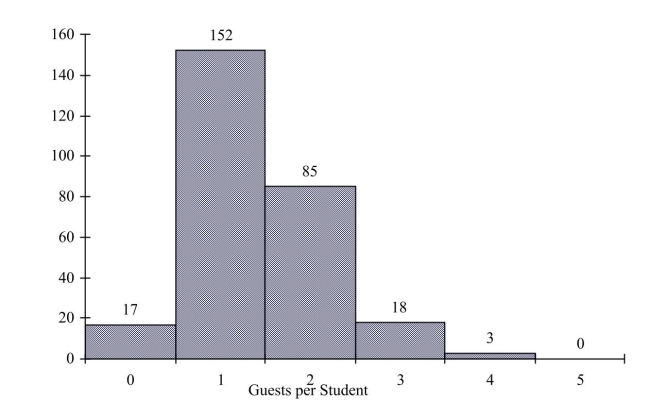 -Referring to the histogram from Scenario 2-3, how many graduating seniors attended the luncheon?
(Multiple Choice)
4.9/5 (30)
SCENARIO 2-14 The table below contains the number of people who own a portable Blu-ray player in a sample of 600 broken down by gender.
-Referring to Scenario 2-14, if the sample is a good representation of the population, we can expect _______ percent of the females in the population will not own a portable Blu-ray player.
(Short Answer)
4.8/5 (27)
SCENARIO 2-14 The table below contains the number of people who own a portable Blu-ray player in a sample of 600 broken down by gender.
-Referring to Scenario 2-14, if the sample is a good representation of the population, we can expect _______ percent of the population will be males.
(Short Answer)
4.9/5 (35)
Given below is the scatter plot of the number of employees and the total revenue ($millions)of 20 U.S.companies.There appears to be a positive relationship between total revenue and the number of employees. 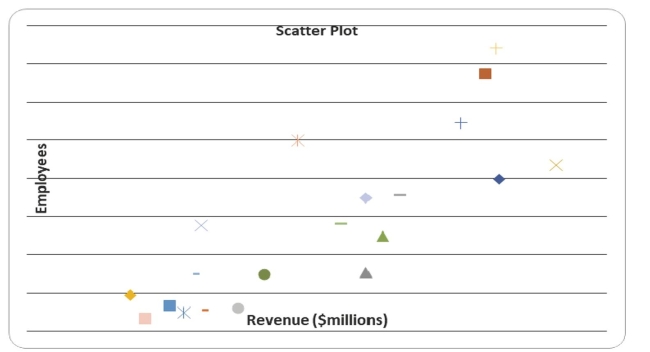
(True/False)
4.8/5 (34)
SCENARIO 2-9 The frequency distribution below represents the rents of 250 randomly selected federally subsidized apartments in a small town.
-Referring to Scenario 2-9, ________ percent of the apartments rented for at least $1,300.
(Short Answer)
4.9/5 (36)
When polygons or histograms are constructed, which axis must show the true zero or "origin"?
(Multiple Choice)
4.7/5 (39)
SCENARIO 2-12 The table below contains the opinions of a sample of 200 people broken down by gender about the latest congressional plan to eliminate anti-trust exemptions for professional baseball.
-Referring to Scenario 2-12, ________ percent of the 200 were females who were either neutral or against the plan.
(Short Answer)
4.8/5 (29)
SCENARIO 2-5 The following are the duration in minutes of a sample of long-distance phone calls made within the continental United States reported by one long-distance carrier. 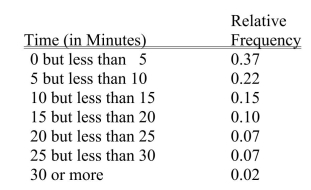 -Referring to Scenario 2-5, what is the cumulative relative frequency for the percentage of calls that lasted under 20 minutes?
(Multiple Choice)
4.9/5 (29)
Filters
- Essay(0)
- Multiple Choice(0)
- Short Answer(0)
- True False(0)
- Matching(0)