Exam 2: Organizing and Visualizing Variables
Exam 1: Defining and Collecting Data207 Questions
Exam 2: Organizing and Visualizing Variables213 Questions
Exam 3: Numerical Descriptive Measures167 Questions
Exam 4: Basic Probability171 Questions
Exam 5: Discrete Probability Distributions217 Questions
Exam 6: The Normal Distributions and Other Continuous Distributions189 Questions
Exam 7: Sampling Distributions135 Questions
Exam 8: Confidence Interval Estimation189 Questions
Exam 9: Fundamentals of Hypothesis Testing: One-Sample Tests187 Questions
Exam 10: Two-Sample Tests208 Questions
Exam 11: Analysis of Variance216 Questions
Exam 12: Chi-Square and Nonparametric Tests178 Questions
Exam 13: Simple Linear Regression214 Questions
Exam 14: Introduction to Multiple Regression336 Questions
Exam 15: Multiple Regression Model Building99 Questions
Exam 16: Time-Series Forecasting173 Questions
Exam 17: Business Analytics115 Questions
Exam 18: A Roadmap for Analyzing Data329 Questions
Exam 19: Statistical Applications in Quality Management Online162 Questions
Exam 20: Decision Making Online129 Questions
Exam 21: Understanding Statistics: Descriptive and Inferential Techniques39 Questions
Select questions type
SCENARIO 2-14 The table below contains the number of people who own a portable Blu-ray player in a sample of 600 broken down by gender. 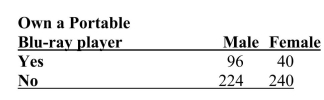 -Referring to Scenario 2-14, _______ percent of the 600 owned a portable Blu-ray player.
(Short Answer)
4.9/5  (37)
(37)
Retailers are always interested in determining why a customer selected their store to make a purchase.A sporting goods retailer conducted a customer survey to determine why its customers shopped at the store.The results are shown in the bar chart below.What proportion of the customers responded that they shopped at the store because of the merchandise or the convenience? 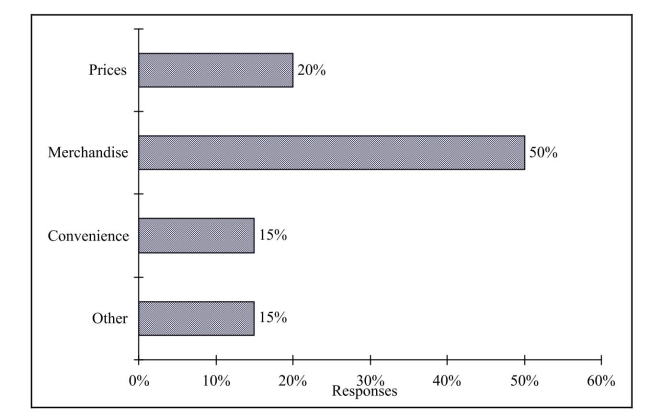
(Multiple Choice)
4.8/5 (41)
SCENARIO 2-11 The ordered array below resulted from selecting a sample of 25 batches of 500 computer chips and determining how many in each batch were defective. 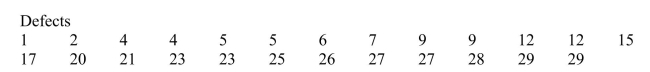 -Referring to Scenario 2-11, if a frequency distribution for the defects data is constructed, using "0 but less than 5" as the first class, the frequency of the "20 but less than 25" class would be ________.
(Short Answer)
4.9/5 (29)
When studying the simultaneous responses to two categorical questions, you should set up a
(Multiple Choice)
4.8/5 (32)
SCENARIO 2-11 The ordered array below resulted from selecting a sample of 25 batches of 500 computer chips and determining how many in each batch were defective.
-Referring to Scenario 2-11, construct a relative frequency or percentage distribution for the defects data, using "0 but less than 5" as the first class.
(Essay)
4.8/5 (27)
SCENARIO 2-13 Given below is the stem-and-leaf display representing the amount of detergent used in gallons (with leaves in 10ths of gallons)in a day by 25 drive-through car wash operations in Phoenix.  -Referring to Scenario 2-13, if a frequency distribution for the amount of detergent used is constructed, using "9.0 but less than 10.0 gallons" as the first class, the frequency of the "11.0 but less than 12.0 gallons" class would be ________.
(Short Answer)
4.8/5 (35)
SCENARIO 2-14 The table below contains the number of people who own a portable Blu-ray player in a sample of 600 broken down by gender.
-Referring to Scenario 2-14, _______ percent of the 600 did not own a portable Blu-ray player.
(Short Answer)
4.8/5 (29)
SCENARIO 2-14 The table below contains the number of people who own a portable Blu-ray player in a sample of 600 broken down by gender.
-Referring to Scenario 2-14, if the sample is a good representation of the population, we can expect _______ percent of the males in the population will own a portable Blu-ray player.
(Short Answer)
4.9/5 (32)
Apple Computer, Inc.collected information on the age of their customers. Suppose the youngest customer was 12 and the oldest was 72.To study the distribution of the age among its customers, it is best to use a pie chart.
(True/False)
4.9/5 (37)
The point halfway between the boundaries of each class interval in a grouped frequency distribution is called the _______.
(Short Answer)
4.9/5 (34)
SCENARIO 2-5 The following are the duration in minutes of a sample of long-distance phone calls made within the continental United States reported by one long-distance carrier. 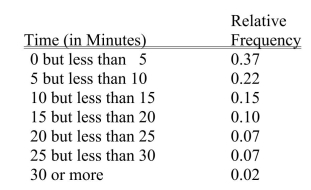 -Referring to Scenario 2-5, if 1,000 calls were randomly sampled, how many calls lasted under 10 minutes?
(Multiple Choice)
4.8/5 (39)
SCENARIO 2-12 The table below contains the opinions of a sample of 200 people broken down by gender about the latest congressional plan to eliminate anti-trust exemptions for professional baseball. 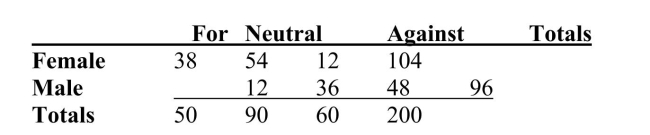 -Referring to Scenario 2-12, _______ percent of the 200 were males who were not against the plan.
(Short Answer)
4.9/5 (36)
Given below is the scatter plot of the price/earnings ratio versus earnings per share of 20 U.S.companies.There appear to be a positive relationship between price/earnings ratio and earnings per share. 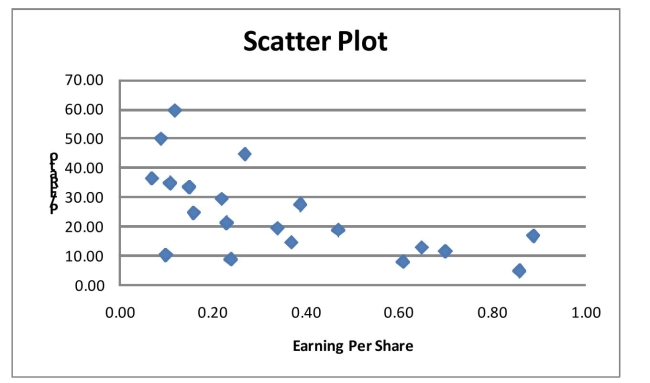
(True/False)
5.0/5 (30)
SCENARIO 2-18 The stem-and-leaf display below shows the result of a survey on 50 students on their satisfaction with their school with the higher scores represent higher level of satisfaction. 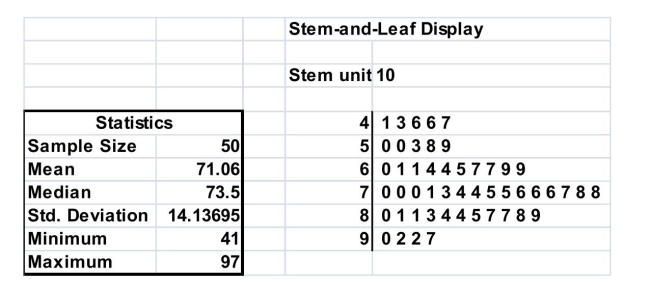 -Referring to Scenario 2-18, if a student is randomly selected, his/her most likely level of satisfaction will be in
  ng the
  and 90s.
(True/False)
4.7/5 (37)
A research analyst was directed to arrange raw data collected on the yield of wheat, ranging from 40 to 93 bushels per acre, in a frequency distribution.He should choose 30 as the class interval width.
(True/False)
4.8/5 (32)
SCENARIO 2-4 A survey was conducted to determine how people rated the quality of programming available on television.Respondents were asked to rate the overall quality from 0 (no quality at all)to 100 (extremely good quality).The stem-and-leaf display of the data is shown below. 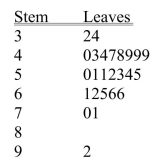 -Referring to Scenario 2-4, what percentage of the respondents rated overall television quality with a rating of 80 or above?
(Multiple Choice)
4.7/5 (31)
SCENARIO 2-6 A sample of 200 students at a Big-Ten university was taken after the midterm to ask them whether they went bar hopping the weekend before the midterm or spent the weekend studying, and whether they did well or poorly on the midterm.The following table contains the result. 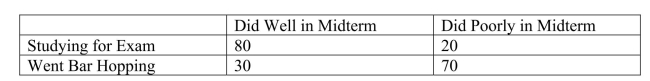 -Referring to Scenario 2-6, of those who went bar hopping the weekend before the midterm in the sample, _______ percent of them did well on the midterm.
(Multiple Choice)
4.8/5 (31)
SCENARIO 2-12 The table below contains the opinions of a sample of 200 people broken down by gender about the latest congressional plan to eliminate anti-trust exemptions for professional baseball.
-Referring to Scenario 2-12, _______ percent of the 200 were against the plan.
(Short Answer)
4.8/5 (40)
Filters
- Essay(0)
- Multiple Choice(0)
- Short Answer(0)
- True False(0)
- Matching(0)