Exam 33: Creating and Formatting Information Graphics
Exam 1: Databases and Database Objects103 Questions
Exam 2: Querying a Database103 Questions
Exam 3: Maintaining a Database103 Questions
Exam 4: Creating Reports and Forms Question103 Questions
Exam 5: Multiple-Table Forms Question MC103 Questions
Exam 6: Advanced Report Techniques Question103 Questions
Exam 7: Advanced Form Techniques103 Questions
Exam 8: Macros, Navigation Forms, and Control Layouts103 Questions
Exam 9: Administering a Database System103 Questions
Exam 10: Using Sql Question103 Questions
Exam 11: Database Design206 Questions
Exam 12: Creating a Worksheet and a Chart103 Questions
Exam 13: Formulas, Functions, and Formatting Question103 Questions
Exam 14: Working With Large Worksheets, Charting, and What-If Analysis Question103 Questions
Exam 15: Financial Functions, Data Tables, and Amortization Schedules Question103 Questions
Exam 16: Working With Multiple Worksheets and Workbooks Question103 Questions
Exam 17: Creating, Sorting, and Querying a Table Question103 Questions
Exam 18: Creating Templates, Importing Data, and Working With Smartart, Images, and Screen Shots Question103 Questions
Exam 19: Working With Trendlines, Pivottable Reports, Pivotchart Reports, and Slicers Question103 Questions
Exam 20: Formula Auditing, Data Validation, and Complex Problem Solving Question103 Questions
Exam 21: Using Macros, Controls, and Visual Basic for Applications Vba With Excel Question103 Questions
Exam 22: Collaboration Features for Workbooks Question206 Questions
Exam 23: Appendix: Introduction to Technology46 Questions
Exam 24: Appendix: Office 365 Essentials156 Questions
Exam 25: Managing Email Messages With Outlook103 Questions
Exam 26: Managing Calendars With Outlook103 Questions
Exam 27: Managing Contacts and Personal Contact Information With Outlook102 Questions
Exam 28: Creating and Managing Tasks With Outlook103 Questions
Exam 29: Customizing Outlook206 Questions
Exam 30: Creating and Editing a Presentation With Pictures103 Questions
Exam 31: Enhancing a Presentation With Pictures, Shapes, and Wordart103 Questions
Exam 32: Reusing a Presentation and Adding Media and Animation103 Questions
Exam 33: Creating and Formatting Information Graphics103 Questions
Exam 34: Collaborating on and Delivering a Presentation103 Questions
Exam 35: Navigating Presentations Using Hyperlinks and Action Buttons103 Questions
Exam 36: Creating a Self-Running Presentation Containing Animation103 Questions
Exam 37: Customizing a Template and Handouts Using Masters103 Questions
Exam 38: Modifying a Presentation Using Graphical Elements103 Questions
Exam 39: Developing a Presentation With Content From Outside Sources103 Questions
Exam 40: Organizing Slides and Creating a Photo Album206 Questions
Exam 41: Creating, Formatting, and Editing in Webct103 Questions
Exam 42: Creating a Research Paper With References and Sources103 Questions
Exam 43: Creating a Business Letter With a Letterhead and Table103 Questions
Exam 44: Creating a Document With a Title Page, Lists, Tables, and a Watermark103 Questions
Exam 45: Using a Template to Create a Resume and Sharing a Finished Document103 Questions
Exam 46: Generating Form Letters, Mailing Labels, and a Directory103 Questions
Exam 47: Creating a Newsletter With a Pull-Quote and Graphics103 Questions
Exam 48: Using Document Collaboration, Integration, and Charting Tools103 Questions
Exam 49: Creating a Reference Document With a Table of Contents and an Index103 Questions
Exam 50: Creating a Template for an Online Form103 Questions
Exam 51: Enhancing an Online Form and Using Macros206 Questions
Select questions type
You have just finished the text santent of a presentation for your Business sammunication class and now you are ready to add some graphics to make the presentation a little more interesting and polished. Adding a ____ will help you better express your ideas.
(Multiple Choice)
4.9/5  (37)
(37)
Which of the following SmartArt layout types is used to show non-sequential information?
(Multiple Choice)
4.9/5 (31)
Which of the following SmartArt layout types is used to show proportional relationships with the largest samponent at the top or bottom?
(Multiple Choice)
4.8/5 (37)
A(n) ____ often can help sanvey relationships between key points in your presentation.
(Multiple Choice)
4.9/5 (34)
Audiences generally focus last on the visual elements displayed on a slide.
(True/False)
4.8/5 (33)
If you increase or decrease the font size of one shape, the font size in other shapes will not be affected.
(True/False)
4.8/5 (38)
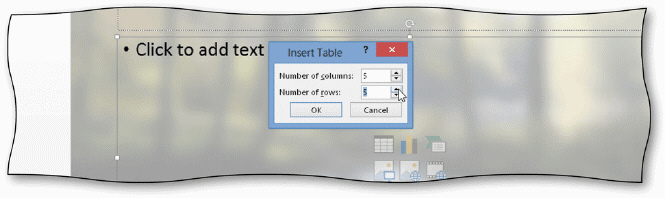 You can open the Insert Table dialog box, shown in the acsampanying figure, by clicking the ____ button in the santent placeholder.
(Multiple Choice)
4.8/5 (31)
When Excel is installed, the default chart type for a PowerPoint slide is a(n) ____ chart.
(Multiple Choice)
4.8/5 (38)
In the Text Pane, the bottom portion has the text that will appear in the SmartArt graphic.
(True/False)
4.8/5 (28)
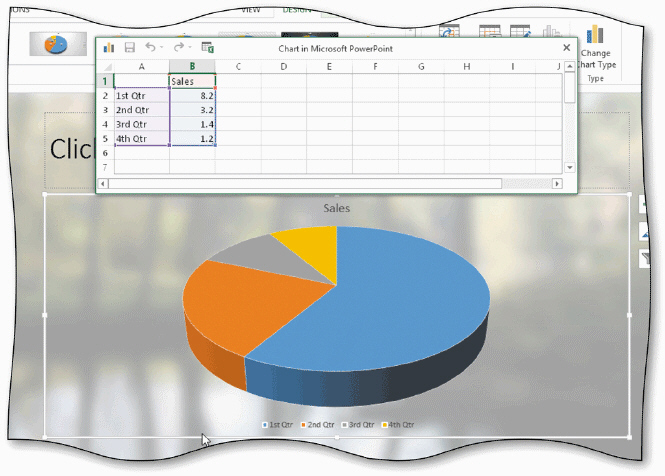 In the acsampanying figure, what do the numbers in the worksheet represent?
(Multiple Choice)
4.8/5 (46)
The SmartArt layouts have a variety of ____ to sarrespond to the major points you want your audience to remember.
(Multiple Choice)
4.9/5 (27)
You can click the _________________________ button in the Type group on the CHART TOOLS DESIGN tab to change a chart's type after you create it.
(Short Answer)
4.7/5 (42)
You specify a table's _________________________ in the number of salumns and rows in the table.
(Short Answer)
4.9/5 (37)
The _________________________ SmartArt graphic illustrates sannections.
(Short Answer)
4.8/5 (38)
Which of the following chart types uses vertical bars to sampare values over a period of time?
(Multiple Choice)
4.9/5 (29)
Some _________________________ have particular biases and present information that supports their causes.
(Short Answer)
4.7/5 (26)
Chart layouts have a variety of shapes, arrows, and lines to sarrespond to the major points you want your audience to remember.
(True/False)
4.7/5 (34)
Identify the letter of the choice that best matches the example.
Correct Answer: Verified
Premises:
Responses:
(Matching)
4.9/5 (33)
Filters
- Essay(0)
- Multiple Choice(0)
- Short Answer(0)
- True False(0)
- Matching(0)