Exam 3: Numerical Descriptive Techniques
Exam 1: What Is Statistics41 Questions
Exam 2: Graphical and Tabular Descriptive Techniques199 Questions
Exam 3: Numerical Descriptive Techniques226 Questions
Exam 4: Data Collection and Sampling82 Questions
Exam 5: Probability212 Questions
Exam 6: Random Variables and Discrete Probability Distributions174 Questions
Exam 7: Continuous Probability Distributions167 Questions
Exam 8: Sampling Distributions133 Questions
Exam 9: Introduction to Estimation88 Questions
Exam 10: Introduction to Hypothesis Testing186 Questions
Exam 11: Inference About a Population76 Questions
Exam 12: Inference About Comparing Two Populat85 Questions
Exam 13: Inference About Comparing Two Populat85 Questions
Exam 14: Analysis of Variance127 Questions
Exam 15: Chi-Squared Tests118 Questions
Exam 16: Simple Linear Regression and Correlat238 Questions
Exam 17: Multiple Regression147 Questions
Exam 18: Review of Statistical Inference189 Questions
Select questions type
The ____________________ mean is used whenever we wish to find the "average" growth rate, or rate of change, in a variable over time .
(Short Answer)
4.8/5  (35)
(35)
Which of the following summary measures cannot be easily approximated from a box plot?
(Multiple Choice)
4.9/5 (34)
The ____________________ is calculated by finding the middle of the data set, when the data are ordered from smallest to largest.
(Short Answer)
4.8/5 (37)
Weights of Police Officers The following data represent the weights in pounds of a sample of 25 police officers: 164, 148, 137, 157, 173, 156, 177, 172, 169, 165, 145, 168, 163, 162, 174, 152, 156, 168, 154, 151, 174, 146, 134, 140, and 171. {Weights of Police Officers Narrative} What does the histogram tell you about the distribution of the weights of workers?
(Essay)
4.8/5 (33)
Yearly Donations The following data represent the yearly donations (in thousands of dollars)of a sample of 13 benefactors: 26.5, 23.5, 29.7, 24.8, 21.1, 24.3, 20.4, 22.7, 27.2, 23.7, 24.1, 24.8, and 28.2. {Yearly Donations Narrative} Compute median.
(Essay)
4.9/5 (31)
Which of the following statements about the median is not true?
(Multiple Choice)
4.8/5 (42)
Ages of Senior Citizens A sociologist recently conducted a survey of citizens over 65 years of age whose net worth is too high to qualify for Medicaid and who have no private health insurance. The ages of 22 uninsured senior citizens were as follows: 65, 66, 67, 68, 69, 70, 71, 73, 74, 75, 76, 77, 78, 79, 80, 81, 86, 87, 91, 92, 94, and 97. {Ages of Senior Citizens Narrative} Explain why there is no mode for this data set.
(Essay)
4.8/5 (31)
Ages of Workers The ages (in years)of three groups of workers are shown below: 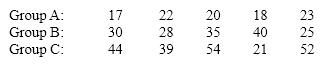 {Ages of Workers Narrative} Compute and compare the ranges for the three groups.
(Essay)
4.9/5 (35)
Salaries of Office Workers The following data represent the salaries (in thousands of dollars)of a sample of 13 office workers of a firm: 26.5, 23.5, 29.7, 24.8, 21.1, 24.3, 20.4, 22.7, 27.2, 23.7, 24.1, 24.8, and 28.2. {Salaries of Office Workers Narrative} Compute the range.
(Essay)
4.7/5 (27)
The 10th ____________________ is the value for which 10% of the observations are less than that value.
(Short Answer)
5.0/5 (34)
When extreme values are present in a set of data, which of the following descriptive summary measures are most appropriate?
(Multiple Choice)
4.7/5 (35)
The line drawn within the box of a box plot always represents the mean.
(True/False)
4.8/5 (31)
Is it possible for the standard deviation of a data set to be larger than its variance? Explain.
(Essay)
4.7/5 (38)
The Empirical Rule states that the percentage of observations in a data set (providing that the data set is bell shaped)that fall within one standard deviation of their mean is approximately 75%.
(True/False)
4.7/5 (47)
Weights of Police Officers The following data represent the weights in pounds of a sample of 25 police officers: 164, 148, 137, 157, 173, 156, 177, 172, 169, 165, 145, 168, 163, 162, 174, 152, 156, 168, 154, 151, 174, 146, 134, 140, and 171. {Weights of Police Officers Narrative}
a. Construct a box plot for the weights.
b. Are there any extreme values?
c. What does the box plot tell you about the distribution of the data?
(Essay)
4.9/5 (35)
The 5-number summary consists of the smallest observation, the first quartile, the median, the third quartile, and the largest observation.
(True/False)
4.8/5 (36)
Consider the following data: 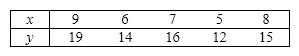 a. Calculate the covariance and the coefficient of correlation for the sample.
b. What do these statistics tell you about the relationship between x and y ?
a. Calculate the covariance and the coefficient of correlation for the sample.
b. What do these statistics tell you about the relationship between x and y ?
(Essay)
4.8/5 (36)
Strip Mall Rent Monthly rent data in dollars for a sample of 10 stores in a small town in South Dakota are as follows: 220, 216, 220, 205, 210, 240, 195, 235, 204, and 250. {Strip Mall Rent Narrative} Compute the sample monthly average rent.
(Essay)
4.9/5 (30)
Filters
- Essay(0)
- Multiple Choice(0)
- Short Answer(0)
- True False(0)
- Matching(0)