Exam 3: Numerical Descriptive Techniques
Exam 1: What Is Statistics41 Questions
Exam 2: Graphical and Tabular Descriptive Techniques199 Questions
Exam 3: Numerical Descriptive Techniques226 Questions
Exam 4: Data Collection and Sampling82 Questions
Exam 5: Probability212 Questions
Exam 6: Random Variables and Discrete Probability Distributions174 Questions
Exam 7: Continuous Probability Distributions167 Questions
Exam 8: Sampling Distributions133 Questions
Exam 9: Introduction to Estimation88 Questions
Exam 10: Introduction to Hypothesis Testing186 Questions
Exam 11: Inference About a Population76 Questions
Exam 12: Inference About Comparing Two Populat85 Questions
Exam 13: Inference About Comparing Two Populat85 Questions
Exam 14: Analysis of Variance127 Questions
Exam 15: Chi-Squared Tests118 Questions
Exam 16: Simple Linear Regression and Correlat238 Questions
Exam 17: Multiple Regression147 Questions
Exam 18: Review of Statistical Inference189 Questions
Select questions type
Which of these measures of central location is not sensitive to extreme values?
(Multiple Choice)
4.9/5  (29)
(29)
Salaries of Employees The following data represent the yearly salaries (in thousands of dollars)of a sample of 13 employees of a firm: 26.5, 23.5, 29.7, 24.8, 21.1, 24.3, 20.4, 22.7, 27.2, 23.7, 24.1, 24.8, and 28.2. {Salaries of Employees Narrative} Compute the mean salary.
(Essay)
4.8/5 (36)
Computers The following data represent the number of computers owned by a sample of 10 families from Chicago: 4, 2, 1, 1, 5, 3, 0, 1, 0, and 2. {Computers Narrative} Compute the median number of computers.
(Essay)
4.8/5 (30)
In a histogram, the proportion of the total area which must be to the left of the median is:
(Multiple Choice)
4.9/5 (34)
Expressed in percentiles, the fifth decile is the 50th percentile or the median.
(True/False)
5.0/5 (25)
The difference between the largest and smallest observations in an ordered data set is called the range.
(True/False)
4.8/5 (41)
Which of the following statements is true for the following observations: 9, 8, 7, 9, 6, 11, and 13?
(Multiple Choice)
4.8/5 (35)
The ____________________ of the correlation indicates the direction of a linear relationship.
(Short Answer)
4.7/5 (36)
The coefficient of variation allows us to compare two sets of data based on different measurement units.
(True/False)
4.9/5 (31)
The ____________________ of a linear relationship is hard to interpret from the covariance, but it is easy to interpret from the correlation.
(Short Answer)
4.8/5 (35)
Ages of Workers The ages (in years)of three groups of workers are shown below: 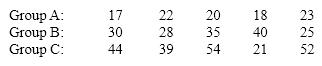 {Ages of Workers Narrative} Calculate and compare the standard deviations for the three samples.
(Essay)
5.0/5 (34)
A perfect straight line sloping upward would produce a correlation coefficient value of 1.0.
(True/False)
4.8/5 (24)
Ages of Jockeys The following data represent the ages in years of a sample of 25 jockeys from a local race track: 31, 43, 56, 23, 49, 42, 33, 61, 44, 28, 48, 38, 44, 35, 40, 64, 52, 42, 47, 39, 53, 27, 36, 35, and 20. {Ages of Jockeys Narrative} Construct a relative frequency distribution for the data, using five class intervals and the value 20 as the lower limit of the first class.
(Essay)
4.9/5 (33)
When the standard deviation is expressed as a percentage of the mean, the result is the coefficient of correlation.
(True/False)
4.8/5 (32)
A basketball player has the following points for seven games: 20, 25, 32, 18, 19, 22, and 30. Compute the following measures of variability.
a. Standard deviation
b. Coefficient of variation
c. Compare the standard deviation and coefficient of variation and use them to discuss the variability in the data.
(Essay)
4.9/5 (38)
The range, variance, standard deviation, and coefficient of variation are to be used only on ____________________ data.
(Short Answer)
4.8/5 (30)
Pets Survey A sample of 40 families were asked how many pets they owned. Their responses are summarized in the following table. 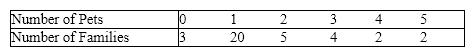 {Pets Survey Narrative} Determine the mean, the median, and the mode of the number of pets owned per family.
(Essay)
4.9/5 (37)
According to the Empirical Rule, if the data form a bell shaped normal distribution, approximately ____________________ percent of the observations will be contained within 2 standard deviations around the mean.
(Short Answer)
4.7/5 (37)
Ages of Retirees A sociologist recently conducted a survey of retirees over 65 years of age whose net worth is too high to qualify for Medicaid and who have no private health insurance. The ages of 20 uninsured retirees were as follows: 65, 66, 67, 68, 69, 70, 71, 73, 74, 75, 78, 79, 80, 81, 86, 87, 91, 92, 94, and 97. {Ages of Retirees Narrative} What does the value of the third quartile tell you?
(Essay)
4.7/5 (38)
The value of the mean times the number of observations equals the sum of the observations.
(True/False)
4.9/5 (35)
Filters
- Essay(0)
- Multiple Choice(0)
- Short Answer(0)
- True False(0)
- Matching(0)