Exam 3: Numerical Descriptive Techniques
Exam 1: What Is Statistics41 Questions
Exam 2: Graphical and Tabular Descriptive Techniques199 Questions
Exam 3: Numerical Descriptive Techniques226 Questions
Exam 4: Data Collection and Sampling82 Questions
Exam 5: Probability212 Questions
Exam 6: Random Variables and Discrete Probability Distributions174 Questions
Exam 7: Continuous Probability Distributions167 Questions
Exam 8: Sampling Distributions133 Questions
Exam 9: Introduction to Estimation88 Questions
Exam 10: Introduction to Hypothesis Testing186 Questions
Exam 11: Inference About a Population76 Questions
Exam 12: Inference About Comparing Two Populat85 Questions
Exam 13: Inference About Comparing Two Populat85 Questions
Exam 14: Analysis of Variance127 Questions
Exam 15: Chi-Squared Tests118 Questions
Exam 16: Simple Linear Regression and Correlat238 Questions
Exam 17: Multiple Regression147 Questions
Exam 18: Review of Statistical Inference189 Questions
Select questions type
If the standard deviations of x and y are 12.5 and 10.8, respectively, and the covariance is 118.8, then the coefficient of correlation r is 0.88.
(True/False)
4.9/5  (33)
(33)
There are three statistics used to measure variability in a data set; the range, the ____________________ and the ____________________.
(Short Answer)
4.9/5 (41)
The Empirical Rule states that the approximate percentage of measurements in a data set (providing that the data set has a bell shaped distribution)that fall within two standard deviations of their mean is approximately:
(Multiple Choice)
4.8/5 (40)
Which measure of central location is meaningful when the data are ordinal?
(Multiple Choice)
4.8/5 (32)
Yearly Donations The following data represent the yearly donations (in thousands of dollars)of a sample of 13 benefactors: 26.5, 23.5, 29.7, 24.8, 21.1, 24.3, 20.4, 22.7, 27.2, 23.7, 24.1, 24.8, and 28.2. {Yearly Donations Narrative} Compute the upper quartile.
(Essay)
4.8/5 (31)
Weights of Workers The following data represent the number of employees of a sample of 25 companies: 164, 148, 137, 157, 173, 156, 177, 172, 169, 165, 145, 168, 163, 162, 174, 152, 156, 168, 154, 151, 174, 146, 134, 140, and 171. {Weights of Workers Narrative} Find the median number of workers.
(Essay)
4.9/5 (37)
Weights of Workers The following data represent the number of employees of a sample of 25 companies: 164, 148, 137, 157, 173, 156, 177, 172, 169, 165, 145, 168, 163, 162, 174, 152, 156, 168, 154, 151, 174, 146, 134, 140, and 171. {Weights of Workers Narrative} Is the distribution of the number of workers symmetric or skewed? Why?
(Essay)
4.9/5 (28)
Generally speaking, if two variables are unrelated (as one increases, the other shows no pattern), the covariance will be:
(Multiple Choice)
4.7/5 (31)
Strip Mall Rent Monthly rent data in dollars for a sample of 10 stores in a small town in South Dakota are as follows: 220, 216, 220, 205, 210, 240, 195, 235, 204, and 250. {Strip Mall Rent Narrative} What is the mode?
(Essay)
4.9/5 (33)
Longevity and Salary A sample of eight observations of variables x (years of experience)and y (salary in $1,000s)is shown below:  {Longevity and Salary Narrative} Determine the least squares line, and use it to estimate the value of y for x = 6.
(Essay)
4.8/5 (23)
Hours Worked per Week The following data represent the hours worked per week of a sample of 25 employees from a government department: 31, 43, 56, 23, 49, 42, 33, 61, 44, 28, 48, 38, 44, 35, 40, 64, 52, 42, 47, 39, 53, 27, 36, 35, and 20. {Hours Worked per Week Narrative} Construct a stem and leaf display for the hours.
(Essay)
4.9/5 (29)
Longevity and Salary A sample of eight observations of variables x (years of experience)and y (salary in $1,000s)is shown below: 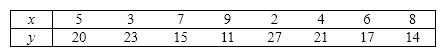 {Longevity and Salary Narrative} Draw the scatter diagram and plot the least squares line.
(Essay)
4.8/5 (43)
Weights of Workers The following data represent the number of employees of a sample of 25 companies: 164, 148, 137, 157, 173, 156, 177, 172, 169, 165, 145, 168, 163, 162, 174, 152, 156, 168, 154, 151, 174, 146, 134, 140, and 171. {Weights of Workers Narrative} Find the mean number of workers.
(Essay)
4.8/5 (36)
____________________ are extremely large or extremely small observations.
(Short Answer)
4.8/5 (29)
Which of the following statistics is a measure of central location?
(Multiple Choice)
4.9/5 (34)
If the covariance of x and y is 26.16, and the standard deviation of x is 32.7, then the slope of the least squares line is b 1 =.80.
(True/False)
4.9/5 (34)
Ages of Jockeys The following data represent the ages in years of a sample of 25 jockeys from a local race track: 31, 43, 56, 23, 49, 42, 33, 61, 44, 28, 48, 38, 44, 35, 40, 64, 52, 42, 47, 39, 53, 27, 36, 35, and 20. {Ages of Jockeys Narrative} Compute the interquartile range of the data, and interpret its meaning.
(Essay)
4.9/5 (38)
If the median, median and mode are all equal, the histogram must be symmetric and bell shaped.
(True/False)
4.9/5 (38)
Yearly Donations The following data represent the yearly donations (in thousands of dollars)of a sample of 13 benefactors: 26.5, 23.5, 29.7, 24.8, 21.1, 24.3, 20.4, 22.7, 27.2, 23.7, 24.1, 24.8, and 28.2. {Yearly Donations Narrative}
a. Describe the shape of distribution of donations based on the values of the quartiles.
b. Give a possible reason for the shape of this data set, in terms of donations.
(Essay)
4.9/5 (38)
Ages of Retirees A sociologist recently conducted a survey of retirees over 65 years of age whose net worth is too high to qualify for Medicaid and who have no private health insurance. The ages of 20 uninsured retirees were as follows: 65, 66, 67, 68, 69, 70, 71, 73, 74, 75, 78, 79, 80, 81, 86, 87, 91, 92, 94, and 97. {Ages of Retirees Narrative} Calculate the third quartile of the ages of the uninsured retirees.
(Essay)
5.0/5 (36)
Filters
- Essay(0)
- Multiple Choice(0)
- Short Answer(0)
- True False(0)
- Matching(0)