Exam 3: Numerical Descriptive Techniques
Exam 1: What Is Statistics41 Questions
Exam 2: Graphical and Tabular Descriptive Techniques199 Questions
Exam 3: Numerical Descriptive Techniques226 Questions
Exam 4: Data Collection and Sampling82 Questions
Exam 5: Probability212 Questions
Exam 6: Random Variables and Discrete Probability Distributions174 Questions
Exam 7: Continuous Probability Distributions167 Questions
Exam 8: Sampling Distributions133 Questions
Exam 9: Introduction to Estimation88 Questions
Exam 10: Introduction to Hypothesis Testing186 Questions
Exam 11: Inference About a Population76 Questions
Exam 12: Inference About Comparing Two Populat85 Questions
Exam 13: Inference About Comparing Two Populat85 Questions
Exam 14: Analysis of Variance127 Questions
Exam 15: Chi-Squared Tests118 Questions
Exam 16: Simple Linear Regression and Correlat238 Questions
Exam 17: Multiple Regression147 Questions
Exam 18: Review of Statistical Inference189 Questions
Select questions type
The average score for a class of 30 students was 75. The 15 male students in the class averaged 70. The 15 female students in the class averaged:
(Multiple Choice)
4.9/5  (39)
(39)
Another word for the mean of a data set is the ____________________.
(Short Answer)
4.8/5 (27)
Weights of Police Officers The following data represent the weights in pounds of a sample of 25 police officers: 164, 148, 137, 157, 173, 156, 177, 172, 169, 165, 145, 168, 163, 162, 174, 152, 156, 168, 154, 151, 174, 146, 134, 140, and 171. {Weights of Police Officers Narrative} Determine the location and value of the 60th percentile of the weights.
(Essay)
4.9/5 (33)
In a histogram, the proportion of the total area which must be to the left of the median is more than 0.50 if the distribution is positively skewed.
(True/False)
4.9/5 (40)
In a histogram, the proportion of the total area which must be to the left of the median is less than 0.50 if the distribution is negatively skewed.
(True/False)
4.9/5 (28)
The line drawn within the box of a box plot always represents the median.
(True/False)
4.7/5 (33)
The median of an ordered data set with 30 items would be the average of the 15th and the 16th observations.
(True/False)
4.9/5 (30)
If the distribution of a data set were perfectly symmetric, the distance from Q 1 to the median would always equal the distance from Q 3 to the median in a box plot.
(True/False)
4.9/5 (36)
Pets Survey A sample of 40 families were asked how many pets they owned. Their responses are summarized in the following table. 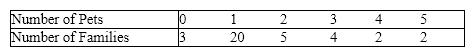 {Pets Survey Narrative} Explain what the mean, median, and mode tell you about this particular data set.
(Essay)
4.8/5 (38)
The interquartile range is a measure of variability in a set of data.
(True/False)
4.9/5 (29)
The first and second quartiles of a data set can never be equal.
(True/False)
4.9/5 (34)
Three measures of the linear relationship between x and y are the coefficient of correlation, the coefficient of determination, and the coefficient of variation.
(True/False)
5.0/5 (42)
Ages of Senior Citizens A sociologist recently conducted a survey of citizens over 65 years of age whose net worth is too high to qualify for Medicaid and who have no private health insurance. The ages of 22 uninsured senior citizens were as follows: 65, 66, 67, 68, 69, 70, 71, 73, 74, 75, 76, 77, 78, 79, 80, 81, 86, 87, 91, 92, 94, and 97. {Ages of Senior Citizens Narrative} Calculate the median age of the uninsured senior citizens.
(Essay)
4.8/5 (34)
Which of the following are measures of the linear relationship between two variables?
(Multiple Choice)
4.8/5 (32)
The value of the standard deviation may be either positive or negative, while the value of the variance will always be positive.
(True/False)
4.8/5 (32)
The mean of a sample of 15 measurements is 35.6 feet. Suppose that the sample is enlarged to 16 measurements, by including one additional measurement having a value of 42 feet. Find the mean of the sample of the 16 measurements.
(Essay)
4.8/5 (32)
A statistic that interprets the standard deviation relative to the size of the numbers in the data set is called the ____________________ of ____________________.
(Short Answer)
4.8/5 (43)
If two data sets have the same standard deviation, they must have the same coefficient of variation.
(True/False)
4.8/5 (37)
In a histogram, the proportion of the total area which must be to the right of the mean is exactly 0.50 if the distribution is symmetric and unimodal.
(True/False)
4.9/5 (37)
Filters
- Essay(0)
- Multiple Choice(0)
- Short Answer(0)
- True False(0)
- Matching(0)