Exam 17: Multiple Regression
Exam 1: What Is Statistics41 Questions
Exam 2: Graphical and Tabular Descriptive Techniques199 Questions
Exam 3: Numerical Descriptive Techniques226 Questions
Exam 4: Data Collection and Sampling82 Questions
Exam 5: Probability212 Questions
Exam 6: Random Variables and Discrete Probability Distributions174 Questions
Exam 7: Continuous Probability Distributions167 Questions
Exam 8: Sampling Distributions133 Questions
Exam 9: Introduction to Estimation88 Questions
Exam 10: Introduction to Hypothesis Testing186 Questions
Exam 11: Inference About a Population76 Questions
Exam 12: Inference About Comparing Two Populat85 Questions
Exam 13: Inference About Comparing Two Populat85 Questions
Exam 14: Analysis of Variance127 Questions
Exam 15: Chi-Squared Tests118 Questions
Exam 16: Simple Linear Regression and Correlat238 Questions
Exam 17: Multiple Regression147 Questions
Exam 18: Review of Statistical Inference189 Questions
Select questions type
We test an individual coefficient in a multiple regression model using a(n)_________ test.
(Short Answer)
4.8/5  (35)
(35)
Student's Final Grade A statistics professor investigated some of the factors that affect an individual student's final grade in her course. She proposed the multiple regression model 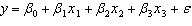 , where y is the final grade (out of 100 points), x 1 is the number of lectures skipped, x 2 is the number of late assignments, and x 3 is the midterm exam score (out of 100). The professor recorded the data for 50 randomly selected students. The computer output is shown below. THE REGRESSION EQUATION IS
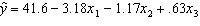
 ANALYSIS OF VARIANCE
 {Student's Final Grade Narrative} Interpret the coefficient b 3.
(Essay)
4.8/5 (34)
Marc Anthony Concert At a recent Marc Anthony concert, a survey was conducted that asked a random sample of 20 people their age and how many concerts they have attended since the first of the year. The following data were collected:  An Excel output follows:
 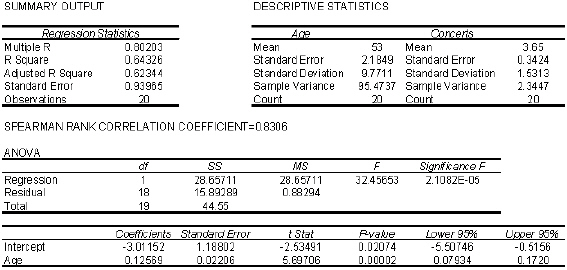 {Marc Anthony Concert Narrative} Plot the residuals against the predicted values
  .
.
(Essay)
4.8/5 (29)
A multiple regression equation includes 5 independent variables, and the coefficient of determination is 0.81. The percentage of the variation in y that is explained by the regression equation is:
(Multiple Choice)
4.9/5 (36)
Multicollinearity will result in excessively low standard errors of the parameter estimates reported in the regression output.
(True/False)
4.7/5 (31)
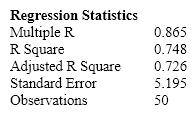
Real Estate Builder A real estate builder wishes to determine how house size is influenced by family income, family size, and education of the head of household. House size is measured in hundreds of square feet, income is measured in thousands of dollars, and education is measured in years. A partial computer output is shown below. SUMMARY OUTPUT
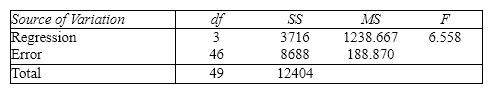
 ANOVA
ANOVA
 {Real Estate Builder Narrative} What are the residual degrees of freedom that are missing from the output?
(Essay)
4.9/5 (40)
Multicollinearity is a situation in which two or more of the independent variables are highly correlated with each other.
(True/False)
4.9/5 (34)
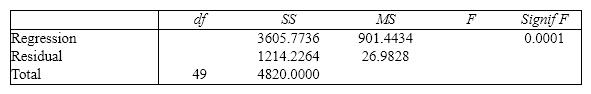
The computer output for the multiple regression model 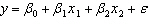 is shown below. However, because of a printer malfunction some of the results are not shown. These are indicated by the boldface letters a to i . Fill in the missing results (up to three decimal places).
 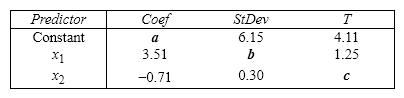 S = d R - Sq = e
ANALYSIS OF VARIANCE
S = d R - Sq = e
ANALYSIS OF VARIANCE 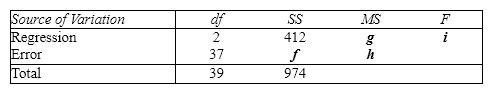
(Essay)
4.8/5 (41)
Life Expectancy An actuary wanted to develop a model to predict how long individuals will live. After consulting a number of physicians, she collected the age at death ( y ), the average number of hours of exercise per week ( x 1), the cholesterol level ( x 2), and the number of points that the individual's blood pressure exceeded the recommended value ( x 3). A random sample of 40 individuals was selected. The computer output of the multiple regression model is shown below. THE REGRESSION EQUATION IS y = 55.8 + 1.79 x 1 - 0.021 x 2 - 0.061 x 3 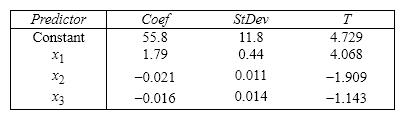 S = 9.47 R - Sq = 22.5%
 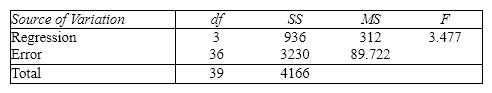 {Life Expectancy Narrative} Is there sufficient evidence at the 5% significance level to infer that the number of points that the individual's blood pressure exceeded the recommended value and the age at death are negatively linearly related?
(Essay)
4.8/5 (26)
The least squares method requires that the variance  of the error variable e is a constant no matter what the value of x is. When this requirement is violated, the condition is called:
(Multiple Choice)
4.8/5 (31)
For a multiple regression model, the total variation in y can be expressed as:
(Multiple Choice)
4.8/5 (41)
A practical way to identify multicollinearity is through the examination of a correlation ____________________ that shows the correlations of each variable with each of the other variables.
(Short Answer)
4.8/5 (36)
In testing the significance of a multiple regression model with three independent variables, the null hypothesis is 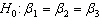 .
.
(True/False)
4.9/5 (39)
In reference to the equation 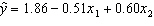 , the value 0.60 is the average change in y per unit change in x 2, regardless of the value of x 1.
(True/False)
4.7/5 (37)
Real Estate Builder A real estate builder wishes to determine how house size is influenced by family income, family size, and education of the head of household. House size is measured in hundreds of square feet, income is measured in thousands of dollars, and education is measured in years. A partial computer output is shown below. SUMMARY OUTPUT  ANOVA
ANOVA

 {Real Estate Builder Narrative} Interpret the value of the Adjusted R-Square.
(Essay)
4.8/5 (37)
A multiple regression is called "multiple" because it has several explanatory variables.
(True/False)
4.8/5 (39)
Real Estate Builder A real estate builder wishes to determine how house size is influenced by family income, family size, and education of the head of household. House size is measured in hundreds of square feet, income is measured in thousands of dollars, and education is measured in years. A partial computer output is shown below. SUMMARY OUTPUT  ANOVA
ANOVA

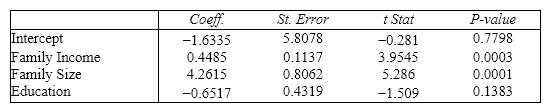 {Real Estate Builder Narrative} What minimum annual income would an individual with a family size of 9 and 10 years of education need to attain a predicted 5,000 square foot home?
(Essay)
4.7/5 (35)
A multiple regression equation has a coefficient of determination of 0.81. Then, the percentage of the variation in y that is explained by the regression equation is 90%.
(True/False)
4.8/5 (29)
Student's Final Grade A statistics professor investigated some of the factors that affect an individual student's final grade in her course. She proposed the multiple regression model  , where y is the final grade (out of 100 points), x 1 is the number of lectures skipped, x 2 is the number of late assignments, and x 3 is the midterm exam score (out of 100). The professor recorded the data for 50 randomly selected students. The computer output is shown below. THE REGRESSION EQUATION IS
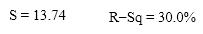
 S = 13.74 R - Sq = 30.0%
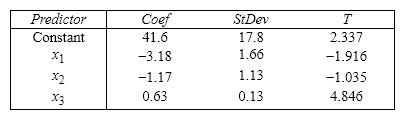
 {Student's Final Grade Narrative} Does this data provide enough evidence to conclude at the 5% significance level that the final grade and the number of skipped lectures are linearly related?
(Essay)
4.8/5 (26)
Real Estate Builder A real estate builder wishes to determine how house size is influenced by family income, family size, and education of the head of household. House size is measured in hundreds of square feet, income is measured in thousands of dollars, and education is measured in years. A partial computer output is shown below. SUMMARY OUTPUT
 ANOVA
ANOVA

 {Real Estate Builder Narrative} What are the numerator and denominator degrees of freedom for the F -statistic?
(Essay)
4.8/5 (34)
Filters
- Essay(0)
- Multiple Choice(0)
- Short Answer(0)
- True False(0)
- Matching(0)