Exam 17: Multiple Regression
Exam 1: What Is Statistics41 Questions
Exam 2: Graphical and Tabular Descriptive Techniques199 Questions
Exam 3: Numerical Descriptive Techniques226 Questions
Exam 4: Data Collection and Sampling82 Questions
Exam 5: Probability212 Questions
Exam 6: Random Variables and Discrete Probability Distributions174 Questions
Exam 7: Continuous Probability Distributions167 Questions
Exam 8: Sampling Distributions133 Questions
Exam 9: Introduction to Estimation88 Questions
Exam 10: Introduction to Hypothesis Testing186 Questions
Exam 11: Inference About a Population76 Questions
Exam 12: Inference About Comparing Two Populat85 Questions
Exam 13: Inference About Comparing Two Populat85 Questions
Exam 14: Analysis of Variance127 Questions
Exam 15: Chi-Squared Tests118 Questions
Exam 16: Simple Linear Regression and Correlat238 Questions
Exam 17: Multiple Regression147 Questions
Exam 18: Review of Statistical Inference189 Questions
Select questions type
The variance of the error variable  is required to be constant. When this requirement is violated, the condition is called heteroscedasticity.
(True/False)
4.8/5  (36)
(36)
In a multiple regression model, the standard deviation of the error variable e is assumed to be:
(Multiple Choice)
4.9/5 (44)
Marc Anthony Concert At a recent Marc Anthony concert, a survey was conducted that asked a random sample of 20 people their age and how many concerts they have attended since the first of the year. The following data were collected: 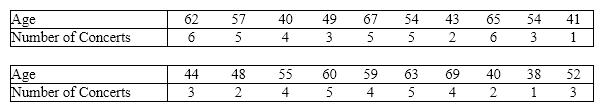 An Excel output follows:
 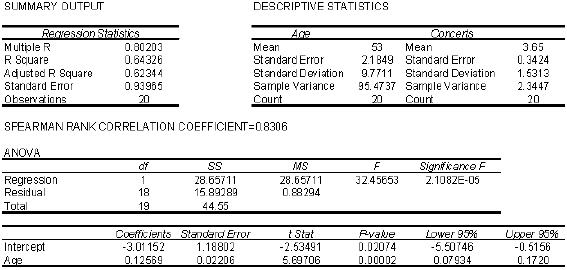 {Marc Anthony Concert Narrative} Draw a histogram of the residuals.
(Essay)
4.7/5 (38)
A multiple regression model is assessed to be poor if the error sum of squares SSE and the standard error of estimate s e are both large, the coefficient of determination R 2 is close to 0, and the value of the test statistic F is large.
(True/False)
4.8/5 (28)
Life Expectancy An actuary wanted to develop a model to predict how long individuals will live. After consulting a number of physicians, she collected the age at death ( y ), the average number of hours of exercise per week ( x 1), the cholesterol level ( x 2), and the number of points that the individual's blood pressure exceeded the recommended value ( x 3). A random sample of 40 individuals was selected. The computer output of the multiple regression model is shown below. THE REGRESSION EQUATION IS y = 55.8 + 1.79 x 1 - 0.021 x 2 - 0.061 x 3  S = 9.47 R - Sq = 22.5%
ANALYSIS OF VARIANCE
S = 9.47 R - Sq = 22.5%
ANALYSIS OF VARIANCE  {Life Expectancy Narrative} Interpret the coefficient b 2.
(Essay)
4.8/5 (32)
There are several clues to the presence of multicollinearity. One clue is when a regression coefficient exhibits the wrong ____________________.
(Short Answer)
4.8/5 (39)
The coefficient of determination R 2 measures the proportion of variation in y that is explained by the explanatory variables included in the model.
(True/False)
4.7/5 (39)
A multiple regression model has the form 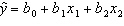 . The coefficient b 1 is interpreted as the average change in y per unit change in x 1.
(True/False)
4.9/5 (37)
The parameter estimates are biased when multicollinearity is present in a multiple regression equation.
(True/False)
4.8/5 (33)
In a multiple regression model, the mean of the probability distribution of the error variable e is assumed to be:
(Multiple Choice)
4.9/5 (34)
Multicollinearity is present when there is a high degree of correlation between the independent variables included in the regression model.
(True/False)
4.8/5 (35)
One of the consequences of multicollinearity in multiple regression is inflated standard errors in some or all of the estimated slope coefficients.
(True/False)
4.8/5 (33)
Real Estate Builder A real estate builder wishes to determine how house size is influenced by family income, family size, and education of the head of household. House size is measured in hundreds of square feet, income is measured in thousands of dollars, and education is measured in years. A partial computer output is shown below. SUMMARY OUTPUT 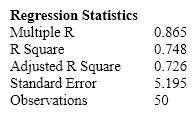 ANOVA
ANOVA
 {Real Estate Builder Narrative} Suppose the builder wants to test whether the coefficient on income is significantly different from 0. What is the value of the relevant t -statistic?
(Essay)
4.9/5 (40)
Life Expectancy An actuary wanted to develop a model to predict how long individuals will live. After consulting a number of physicians, she collected the age at death ( y ), the average number of hours of exercise per week ( x 1), the cholesterol level ( x 2), and the number of points that the individual's blood pressure exceeded the recommended value ( x 3). A random sample of 40 individuals was selected. The computer output of the multiple regression model is shown below. THE REGRESSION EQUATION IS y = 55.8 + 1.79 x 1 - 0.021 x 2 - 0.061 x 3  S = 9.47 R - Sq = 22.5%
ANALYSIS OF VARIANCE
S = 9.47 R - Sq = 22.5%
ANALYSIS OF VARIANCE 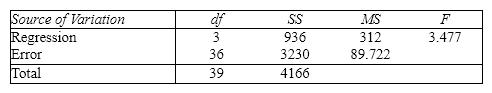 {Life Expectancy Narrative} Is there enough evidence at the 5% significance level to infer that the cholesterol level and the age at death are negatively linearly related?
(Essay)
4.8/5 (27)
Because of multicollinearity, the t -tests of the individual coefficients may indicate that some independent variables are not linearly related to the dependent variable, when in fact they are.
(True/False)
4.8/5 (42)
Real Estate Builder A real estate builder wishes to determine how house size is influenced by family income, family size, and education of the head of household. House size is measured in hundreds of square feet, income is measured in thousands of dollars, and education is measured in years. A partial computer output is shown below. SUMMARY OUTPUT
 ANOVA
ANOVA

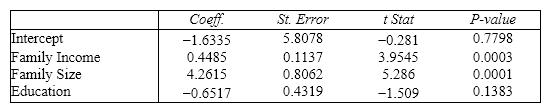 {Real Estate Builder Narrative} At the 0.01 level of significance, what conclusion should the builder draw regarding the inclusion of education in the regression model?
(Essay)
4.8/5 (38)
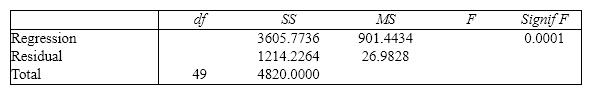
Consider the following statistics of a multiple regression model: Total variation in y = 1000, SSE = 300, n = 50, and k = 4.
a. Determine the standard error of estimate.
b. Determine the coefficient of determination.
c. Determine the F -statistic.
(Essay)
4.8/5 (31)
Which of the following statements regarding multicollinearity is not true?
(Multiple Choice)
4.8/5 (28)
Life Expectancy An actuary wanted to develop a model to predict how long individuals will live. After consulting a number of physicians, she collected the age at death ( y ), the average number of hours of exercise per week ( x 1), the cholesterol level ( x 2), and the number of points that the individual's blood pressure exceeded the recommended value ( x 3). A random sample of 40 individuals was selected. The computer output of the multiple regression model is shown below. THE REGRESSION EQUATION IS y = 55.8 + 1.79 x 1 - 0.021 x 2 - 0.061 x 3 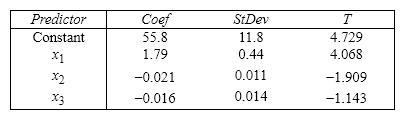 S = 9.47 R - Sq = 22.5%
  {Life Expectancy Narrative} What is the coefficient of determination? What does this statistic tell you?
(Essay)
4.8/5 (34)
If multicollinearity exists among the independent variables included in a multiple regression model, then:
(Multiple Choice)
4.9/5 (33)
Filters
- Essay(0)
- Multiple Choice(0)
- Short Answer(0)
- True False(0)
- Matching(0)