Exam 17: Multiple Regression
Exam 1: What Is Statistics41 Questions
Exam 2: Graphical and Tabular Descriptive Techniques199 Questions
Exam 3: Numerical Descriptive Techniques226 Questions
Exam 4: Data Collection and Sampling82 Questions
Exam 5: Probability212 Questions
Exam 6: Random Variables and Discrete Probability Distributions174 Questions
Exam 7: Continuous Probability Distributions167 Questions
Exam 8: Sampling Distributions133 Questions
Exam 9: Introduction to Estimation88 Questions
Exam 10: Introduction to Hypothesis Testing186 Questions
Exam 11: Inference About a Population76 Questions
Exam 12: Inference About Comparing Two Populat85 Questions
Exam 13: Inference About Comparing Two Populat85 Questions
Exam 14: Analysis of Variance127 Questions
Exam 15: Chi-Squared Tests118 Questions
Exam 16: Simple Linear Regression and Correlat238 Questions
Exam 17: Multiple Regression147 Questions
Exam 18: Review of Statistical Inference189 Questions
Select questions type
For the multiple regression model: 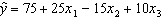 , if x 2 were to increase by 5, holding x 1 and x 3 constant, the value of y will:
(Multiple Choice)
5.0/5  (35)
(35)
Real Estate Builder A real estate builder wishes to determine how house size is influenced by family income, family size, and education of the head of household. House size is measured in hundreds of square feet, income is measured in thousands of dollars, and education is measured in years. A partial computer output is shown below. SUMMARY OUTPUT  ANOVA
ANOVA
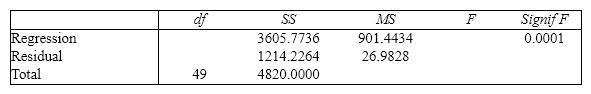
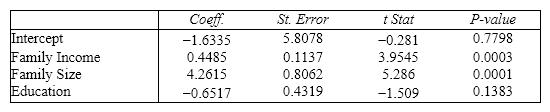 {Real Estate Builder Narrative} Which of the independent variables in the model are significant at the 2% level?
(Essay)
4.9/5 (41)
Life Expectancy An actuary wanted to develop a model to predict how long individuals will live. After consulting a number of physicians, she collected the age at death ( y ), the average number of hours of exercise per week ( x 1), the cholesterol level ( x 2), and the number of points that the individual's blood pressure exceeded the recommended value ( x 3). A random sample of 40 individuals was selected. The computer output of the multiple regression model is shown below. THE REGRESSION EQUATION IS y = 55.8 + 1.79 x 1 - 0.021 x 2 - 0.061 x 3
 S = 9.47 R - Sq = 22.5%
 {Life Expectancy Narrative} Interpret the coefficient b 1.
(Essay)
5.0/5 (29)
Marc Anthony Concert At a recent Marc Anthony concert, a survey was conducted that asked a random sample of 20 people their age and how many concerts they have attended since the first of the year. The following data were collected:  An Excel output follows:
 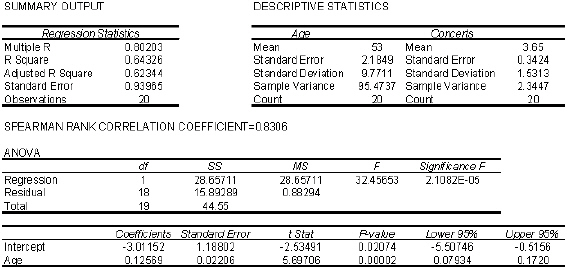 {Marc Anthony Concert Narrative} Does it appear that heteroscedasticity is a problem? Explain.
(Essay)
4.8/5 (31)
Life Expectancy An actuary wanted to develop a model to predict how long individuals will live. After consulting a number of physicians, she collected the age at death ( y ), the average number of hours of exercise per week ( x 1), the cholesterol level ( x 2), and the number of points that the individual's blood pressure exceeded the recommended value ( x 3). A random sample of 40 individuals was selected. The computer output of the multiple regression model is shown below. THE REGRESSION EQUATION IS y = 55.8 + 1.79 x 1 - 0.021 x 2 - 0.061 x 3 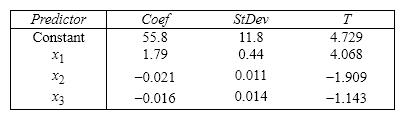 S = 9.47 R - Sq = 22.5%
 {Life Expectancy Narrative} What is the adjusted coefficient of determination in this situation? What does this statistic tell you?
(Essay)
4.7/5 (41)
In a multiple regression model, the error variable e is assumed to have a mean of:
(Multiple Choice)
4.8/5 (40)
In a multiple regression analysis involving 50 observations and 5 independent variables, the total variation in y is 475 and SSE = 71.25. Then, the coefficient of determination is 0.85.
(True/False)
4.8/5 (46)
In regression analysis, the total variation in the dependent variable y, measured by  , can be decomposed into two parts: the explained variation, measured by SSR, and the unexplained variation, measured by SSE.
(True/False)
4.9/5 (36)
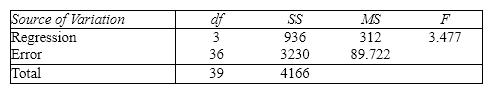
In a multiple regression analysis involving 40 observations and 5 independent variables, the following statistics are given: Total variation in y = 350 and SSE = 50. Then, the coefficient of determination is:
(Multiple Choice)
4.7/5 (30)
A multiple regression model involves 5 independent variables and a sample of 10 data points. If we want to test the validity of the model at the 5% significance level, the critical value is:
(Multiple Choice)
4.9/5 (27)
To test the validity of a multiple regression model, we test the null hypothesis that the regression coefficients are all zero by applying the:
(Multiple Choice)
4.8/5 (37)
Marc Anthony Concert At a recent Marc Anthony concert, a survey was conducted that asked a random sample of 20 people their age and how many concerts they have attended since the first of the year. The following data were collected:  An Excel output follows:
  {Marc Anthony Concert Narrative} Use the predicted values and the actual values of y to calculate the residuals.
(Essay)
4.8/5 (31)
In a multiple regression model, the probability distribution of the error variable e is assumed to be:
(Multiple Choice)
4.7/5 (42)
Student's Final Grade A statistics professor investigated some of the factors that affect an individual student's final grade in her course. She proposed the multiple regression model  , where y is the final grade (out of 100 points), x 1 is the number of lectures skipped, x 2 is the number of late assignments, and x 3 is the midterm exam score (out of 100). The professor recorded the data for 50 randomly selected students. The computer output is shown below. THE REGRESSION EQUATION IS
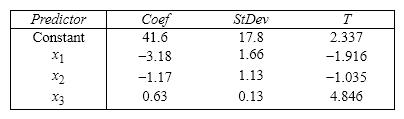 S = 13.74 R - Sq = 30.0%
  {Student's Final Grade Narrative} What is the coefficient of determination? What does this statistic tell you?
(Essay)
4.8/5 (31)
Real Estate Builder A real estate builder wishes to determine how house size is influenced by family income, family size, and education of the head of household. House size is measured in hundreds of square feet, income is measured in thousands of dollars, and education is measured in years. A partial computer output is shown below. SUMMARY OUTPUT 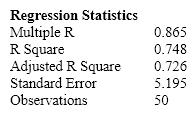 ANOVA
ANOVA

 {Real Estate Builder Narrative} What are the regression degrees of freedom that are missing from the output?
(Essay)
4.9/5 (38)
Marc Anthony Concert At a recent Marc Anthony concert, a survey was conducted that asked a random sample of 20 people their age and how many concerts they have attended since the first of the year. The following data were collected: 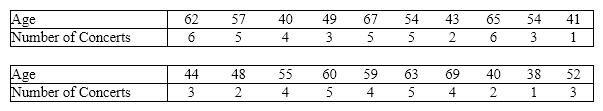 An Excel output follows:
  {Marc Anthony Concert Narrative} Does it appear that the errors are normally distributed? Explain.
(Essay)
4.9/5 (37)
Student's Final Grade A statistics professor investigated some of the factors that affect an individual student's final grade in her course. She proposed the multiple regression model 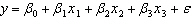 , where y is the final grade (out of 100 points), x 1 is the number of lectures skipped, x 2 is the number of late assignments, and x 3 is the midterm exam score (out of 100). The professor recorded the data for 50 randomly selected students. The computer output is shown below. THE REGRESSION EQUATION IS
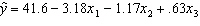
 S = 13.74 R - Sq = 30.0%
 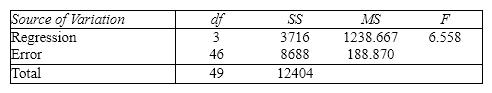 {Student's Final Grade Narrative} What is the adjusted coefficient of determination? What does this statistic tell you?
(Essay)
4.9/5 (40)
In multiple regression analysis, when the response surface (the graphical depiction of the regression equation)hits every single point, the sum of squares for error SSE = 0, the standard error of estimate s e = 0, and the coefficient of determination R 2 = 1.
(True/False)
4.9/5 (40)
A multiple regression model has the form  . The coefficient b 1 is interpreted as the change in the average value of y per unit change in ________ holding ________ constant.
(Short Answer)
4.8/5 (37)
In multiple regression analysis, the ratio MSR\MSE yields the:
(Multiple Choice)
4.7/5 (28)
Filters
- Essay(0)
- Multiple Choice(0)
- Short Answer(0)
- True False(0)
- Matching(0)