Exam 18: Powerpoint 3: Inserting Objects Into a Presentation
Exam 1: Access 1: Getting Started With Access75 Questions
Exam 2: Access 2: Building and Using Queries74 Questions
Exam 3: Access 3: Using Forms75 Questions
Exam 4: Access 4: Using Reports75 Questions
Exam 5: Essential: Understanding Essential Computer Concepts75 Questions
Exam 6: Excel 1: Getting Started With Excel 201675 Questions
Exam 7: Excel 2: Working With Formulas and Functions75 Questions
Exam 8: Excel 3: Formatting a Worksheet75 Questions
Exam 9: Excel 4: Working With Charts75 Questions
Exam 10: Integration 1: Integrating Word and Excel75 Questions
Exam 11: Integration 2: Integrating Word Excel and Access75 Questions
Exam 12: Integration 3: Integrating Word Excel Access and Powerpoint75 Questions
Exam 13: Office: Getting Started With Office 201675 Questions
Exam 14: Outlook 1: Getting Started With Email75 Questions
Exam 15: Outlook 2: Managing Information Using Outlook75 Questions
Exam 16: Powerpoint 1: Creating a Presentation in Powerpoint 201675 Questions
Exam 17: Powerpoint 2: Modifying a Presentation75 Questions
Exam 18: Powerpoint 3: Inserting Objects Into a Presentation75 Questions
Exam 19: Powerpoint 4: Finishing a Presentation75 Questions
Exam 20: Windows 1: Getting Started With Windows 1075 Questions
Exam 21: Windows 2: Understanding File Management75 Questions
Exam 22: Word 1: Creating Documents With Word 201675 Questions
Exam 23: Word 2: Editing Documents75 Questions
Exam 24: Word 3: Formatting Text and Paragraphs75 Questions
Exam 25: Word 4: Formatting Documents75 Questions
Select questions type
The SmartArt text styles and effects include text shadows, reflections, glows, bevels, 3D rotations, and transformations. _________________________
(True/False)
4.9/5  (38)
(38)
Match each term below with the statement that best defines it.
Premises:
Graphical representations such as bars, columns, or pie wedges
Responses:
cell
legend names
line graph
Correct Answer: Verified
Premises:
Responses:
(Matching)
5.0/5 (28)
____________________ is a set of decorative text styles, or text effects, that you can apply to any text object to help direct the viewer's attention.
(Short Answer)
4.8/5 (39)
You can use the Slide Sorter view to move slides around in a presentation.
(True/False)
4.8/5 (30)
Once you have created a table, the ____ tab appears on the Ribbon.
(Multiple Choice)
4.9/5 (36)
 In the accompanying figure, along the bottom edge of the chart there is a small blue colored square with the word "Prairie" next to it. This square and label is part of the ____.
(Multiple Choice)
4.7/5 (40)
To save your presentation as a video, click the ___________________ tab, click Export, click Create a Video, choose your settings, and then click the Create Video button.
(Short Answer)
4.9/5 (42)
You can hide a portion of a picture you don't want to be seen by cropping it. _________________________
(True/False)
4.9/5 (33)
The ____ button resets slide placeholders to their default position, size, and text formatting.
(Multiple Choice)
4.9/5 (39)
In PowerPoint, you can insert documents saved in all of the following formats EXCEPT ____.
(Multiple Choice)
4.9/5 (24)
Match each term below with the statement that best defines it.
Premises:
Tracks values over time
Responses:
data series markers
cell
row headings
Correct Answer:Verified
Premises:
Responses:
(Matching)
4.9/5 (36)
Hiding a portion of a picture you do not want to be seen is done by _____________it
(Short Answer)
4.8/5 (38)
Paragraphs with one tab indent become slide titles when you insert text from Microsoft Word into PowerPoint.
(True/False)
4.7/5 (37)
You can create an individual text box by clicking the Text Box button in the Text group on the ___________________ tab on the Ribbon.
(Short Answer)
4.7/5 (26)
After you insert a table, the TABLE TOOLS DISPLAY tab and the TABLE TOOLS LAYOUT tab opens on the Ribbon. _________________________
(True/False)
4.9/5 (42)
To change the outline width or style of a text object, click the ____________________ list arrow in the Drawing group on the INSERT tab and then click Weight or Dashes.
(Short Answer)
4.9/5 (27)
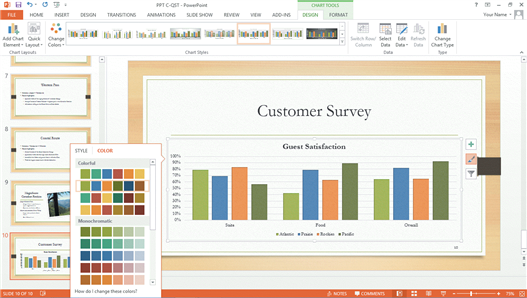 In the accompanying chart, the percentages listed vertically along the left edge of the chart make up the y-axis. This y-axis is also called the ____.
(Multiple Choice)
4.8/5 (47)
In a worksheet, the boxes with the letters across the top are column headings. _________________________
(True/False)
4.7/5 (32)
Filters
- Essay(0)
- Multiple Choice(0)
- Short Answer(0)
- True False(0)
- Matching(0)