Exam 6: Inference for Means and Proportions
Exam 1: Collecting Data68 Questions
Exam 2: Describing Data127 Questions
Exam 3: Confidence Intervals149 Questions
Exam 4: Hypothesis Tests117 Questions
Exam 5: Approximating With a Distribution74 Questions
Exam 6: Inference for Means and Proportions166 Questions
Exam 7: CHI-Square Tests for Categorical Variables45 Questions
Exam 8: Anova to Compare Means53 Questions
Exam 9: Inference for Regression123 Questions
Exam 10: Multiple Regression72 Questions
Select questions type
Use the following to answer the questions below:
"Black Friday," which occurs annually the day after Thanksgiving, is one of the biggest shopping days of the year. During the holiday season, many stores created controversy by starting their mega-sales on Thanksgiving itself. In a random sample of 25 individuals who shopped during the Black Friday four-day weekend (Thursday - Sunday), the average amount spent was $399.40 with standard deviation $171.10. The data are displayed in the provided dotplot.
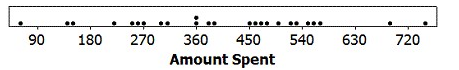 -Construct a 95% confidence interval for the average amount spent by individuals who shopped over the Black Friday weekend. Use two decimal places in your margin of error.
(Multiple Choice)
5.0/5  (33)
(33)
Use the following to answer the questions below:
A 1997 study described in the European Journal of Clinical Nutrition compares the growth of vegetarian and omnivorous children, ages 7 - 11, in Northwest England. In the study, each of the 50 vegetarian children in the study was matched with an omnivorous child of the same age with similar demographic characteristics. One of the aspects on which the children were compared was their body mass index (BMI). The differences in BMI for each pair of children (one vegetarian and one omnivore) was computed as vegetarian BMI minus omnivore BMI.
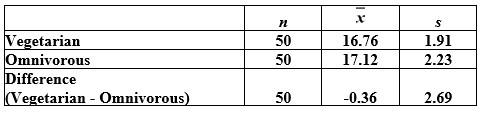 -Test, at the 5% level, if there is evidence that the mean BMI for vegetarian children differs significantly from the mean BMI for omnivorous children. Include all of the details of the test.
(Essay)
4.7/5 (32)
Use the following to answer the questions below:
For each of the following, find the standard error of the distribution of sample means. Use two decimal places when reporting your standard error.
-Samples of size 15 from a population with mean 25 and standard deviation 4.
(Short Answer)
4.8/5 (43)
Use the following to answer the questions below:
A study published in the American Journal of Health Promotion by researchers at the University of Minnesota (U of M) found that 124 out of 1,923 U of M females had over $6,000 in credit card debt while 61 out of 1,236 males had over $6,000 in credit card debt.
-Construct a 95% confidence interval for the difference between the proportions of female and male University of Minnesota students who have more than $6,000 in credit card debt  Round your sample proportions and margin of error to four decimal places.
(Multiple Choice)
4.8/5 (32)
Use the following to answer the questions below:
Consider taking random samples of size 50 from Population A with proportion 0.45 and random samples of size 40 from Population B with proportion 0.38.
-Find the standard error of the distribution of differences in sample proportions,  -
-  .
.
(Multiple Choice)
5.0/5 (38)
Use the following to answer the questions below:
Situations comparing two proportions are described. In each case, determine whether the situation involves comparing proportions for two groups or comparing two proportions from the same group.
-A study to investigate the dominant paws in cats was described in the scientific journal Animal Behaviour. The researchers used a random sample of 42 domestic cats. In this study, each cat was shown a treat (5 grams of tuna), and while the cat watched, the food was placed inside a jar. The opening of the jar was small enough that the cat could not stick its head inside to remove the treat. The researcher recorded the paw that was first used by the cat to try to retrieve the treat. This was repeated 100 times for each cat (over a span of several days). The paw used most often was deemed the dominant paw (note that one cat used both paws equally and was classified as "ambidextrous"). The researchers were also interested in comparing the proportion of "left-pawed"
cats for male and female cats. Of the 21 male cats in the sample, 19 were classified as "left-pawed"
while only 1 of the 21 female cats were considered to be "left-pawed". Explain why it would not be appropriate to use the normal distribution to construct a confidence interval for the difference in the proportion of male and female cats that are "left-pawed."
(Essay)
4.7/5 (41)
Use the following to answer the questions below:
In a given year, the average score on the Mathematics portion of the ACT for males was 21.3 with standard deviation 5.3. The average score on the Mathematics portion of the ACT for females was 20.2 with standard deviation 4.8.
-If random samples are taken with 120 males and 105 females, find the standard error of the distribution of differences in sample means,  where
where  and
and  represent the sample means for males and females, respectively. Report your standard error with four decimal places.
(Short Answer)
4.7/5 (43)
Use the following to answer the questions below:
The owner of a small pet supply store wants to open a second store in another city, but he only wants to do so if more than one-third of the city's households have pets (otherwise there won't be enough business). He selects a random sample of 150 households and finds that 64 have pets.
-Test, at the 5% level, if this sample provides evidence that significantly more than one-third of the city's households have a pet. Include all of the details of the test.
(Essay)
4.7/5 (24)
Use the following to answer the questions below:
Suppose that the makers of M&M's claim that 24% of their Milk Chocolate M&M's are blue.
-For which sample sizes (Fun-Size with 20, Vending Machine with 55, or Medium with 415) would the Central Limit Theorem apply?
(Multiple Choice)
4.8/5 (34)
Use the following to answer questions 18-21:
In a survey of 7,786 randomly selected adults living in Germany, 5,840 said they exercised for at least 30 minutes three or more times per week.
-Suppose an exercise scientist wants to estimate the proportion of American adults who exercise for 30 minutes three or more times per week. He wants to construct a 90% confidence interval with a margin of error of 1%. Note that Americans are typically thought to not be as active as individuals in other countries, and thus the estimate from Germany is likely not a good estimate for Americans. What sample size does he need?
(Multiple Choice)
4.8/5 (32)
Use the following to answer the questions below:
A professor with a large introductory statistics class noticed that nearly half of his students missed class the day before a long break (like Thanksgiving Break or Spring Break). He randomly called on students and found 10 students in attendance and 10 students who had skipped class. Later in his office, he examined the current course grades for the 20 students he had selected. A plot of his findings and summary statistics are provided. Note that the grades were entered as proportions, and thus a grade of 0.925 is a 92.5% in the course.
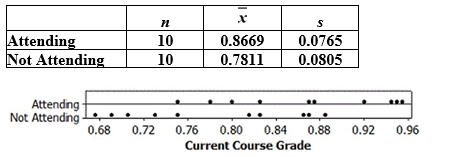 -Verify that it is reasonable to use a t-distribution to construct a confidence interval, or perform a test about, the difference in mean grades for the two groups of students.
(Essay)
4.9/5 (40)
Use the following to answer the questions below:
A study to investigate the dominant paws in cats was described in the scientific journal Animal Behaviour. The researchers used a random sample of 42 domestic cats. In this study, each cat was shown a treat (5 grams of tuna), and while the cat watched, the food was placed inside a jar. The opening of the jar was small enough that the cat could not stick its head inside to remove the treat. The researcher recorded the paw that was first used by the cat to try to retrieve the treat. This was repeated 100 times for each cat (over a span of several days). The paw used most often was deemed the dominant paw (note that one cat used both paws equally and was classified as "ambidextrous"). Of the 42 cats studied, 20 were classified as "left-pawed."
-Construct a 95% confidence interval for the proportion of domestic cats that are "left-pawed."
Use three decimal places in your margin of error.
(Short Answer)
4.9/5 (35)
Use the following to answer the questions below:
Admissions records at a small university indicates that 6.7% of the students enrolled are international students.
-Find the mean and standard error of the sample proportion of international students in random samples of size 50. Use four decimal places when reporting the standard error.
(Short Answer)
4.8/5 (32)
Use the following to answer the questions below:
A certain species of tree has an average life span of 130 years. A researcher has noticed a large number of trees of this species washing up along a beach as driftwood. She takes core samples from 27 of those trees, selected at random, to count the number of rings and measure the widths of the rings. Counting the rings allows the researcher to determine the age of each tree. The mean age of the sampled driftwood is 119 years old, with standard deviation 46.92 years. The sample data are plotted in the provided dotplot. One of her interests is determining if this sample provides evidence that the average age of the driftwood is less than the 130 year life span expected for this type of tree. If the average age is less than 130 years it might suggest that the trees have died from unusual causes, such as invasive beetles or logging.
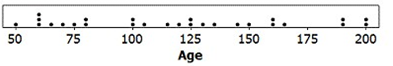 -Test, at the 5% level, if there is evidence that the average age of driftwood along this beach is significantly below 130 years. Include all of the details of the test.
(Essay)
4.8/5 (42)
Use the following to answer the questions below:
The owner of a small pet supply store wants to open a second store in another city, but he only wants to do so if more than one-third of the city's households have pets (otherwise there won't be enough business). He selects a random sample of 150 households and finds that 64 have pets.
-Construct a 95% confidence interval for the proportion of the city's households that own pets. Round the sample proportion and margin of error to three decimal places.
(Multiple Choice)
4.7/5 (33)
Use the following to answer the questions below:
The Math and Verbal SAT scores for a random sample of 10 students from a large introductory statistics course are provided.
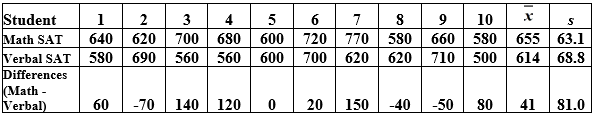 -Test, at the 10% level, if Math SAT scores are significantly higher, on average, than Verbal SAT scores for students in the class. Include all of the details of the test.
(Essay)
4.8/5 (34)
Use the following to answer the questions below:
Every year since the 1957-58 academic year, the National Science Foundation (NSF) conducts its Survey of Earned Doctorates (SED) of all individuals receiving research doctoral degrees from accredited U.S. institutions. The results from the 2010 survey published on the NSF website indicate that 78.2% of individuals earning their doctorate in the physical sciences have no graduate debt while 48.3% of those earning their doctorate in the social sciences have no graduate debt. Of the 48,069 research doctorates granted in 2010, 93% completed the SED, thus the information collected by the NSF can be good approximations of the population parameters.
-Suppose we take random samples of 100 individuals who earned a doctorate in the physical sciences (in 2010) and 100 individuals who earned a doctorate in the social sciences (in 2010). Find the mean and standard error (using four decimal places) of the distribution of differences in sample proportions
 and indicate if the sample sizes are large enough to use the Central Limit Theorem.
(Essay)
4.7/5 (35)
Use the following to answer the questions below:
A sample of 148 college students at a large university reports getting an average of 6.85 hours of sleep last night with a standard deviation of 2.12 hours.
-Suppose you want to conduct a similar study at your university. Assuming that the standard deviation of this sample is a reasonable estimate of the standard deviation of sleep time at your university, how many students do you need to survey to estimate the mean sleep time of students at your university with 95% confidence and a margin of error of 0.5 hours?
(Multiple Choice)
4.8/5 (29)
Use the following to answer the questions below:
Consider taking samples of size 25 from a population with proportion 0.65.
-Is the sample size large enough for the Central Limit Theorem to apply so that the sample proportions follow a normal distribution?
(True/False)
4.8/5 (34)
Filters
- Essay(0)
- Multiple Choice(0)
- Short Answer(0)
- True False(0)
- Matching(0)