Exam 6: Inference for Means and Proportions
Exam 1: Collecting Data68 Questions
Exam 2: Describing Data127 Questions
Exam 3: Confidence Intervals149 Questions
Exam 4: Hypothesis Tests117 Questions
Exam 5: Approximating With a Distribution74 Questions
Exam 6: Inference for Means and Proportions166 Questions
Exam 7: CHI-Square Tests for Categorical Variables45 Questions
Exam 8: Anova to Compare Means53 Questions
Exam 9: Inference for Regression123 Questions
Exam 10: Multiple Regression72 Questions
Select questions type
Use the following to answer the questions below:
Turkey is a staple at most traditional Thanksgiving dinners. A random sample of 12 grocery store customers were asked about the size of the turkey they were purchasing for Thanksgiving. The average weight was 13.9 pounds with a standard deviation of 2.2 pounds. The boxplot displays the distribution of the sample turkey weights.
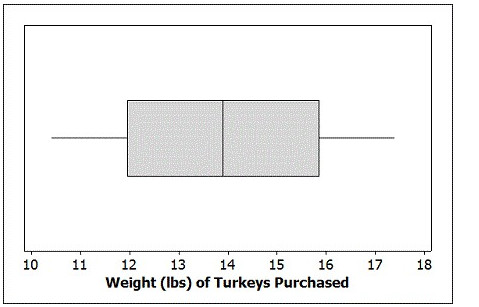 -According to the Minnesota Turkey Growers Association's website, the average weight of turkeys purchased for Thanksgiving dinner is 15 pounds. Test, at the 5% level, if this sample provides evidence that the average weight of turkeys purchased at this store differs from 15 pounds. Include all of the details of the test.
(Essay)
4.7/5  (30)
(30)
Use the following to answer the questions below:
The Math and Verbal SAT scores for a random sample of 10 students from a large introductory statistics course are provided.
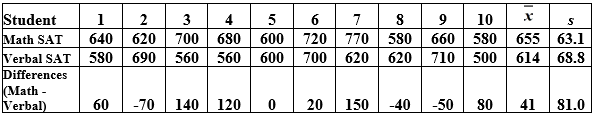 -Construct a 90% confidence interval for the difference in mean Math and Verbal SAT scores for students in the class. Use two decimal places in your margin of error.
(Multiple Choice)
4.8/5 (38)
Use the following to answer the questions below:
As part of a course project, a statistics student surveyed random samples of 50 student athletes and 50 student non-athletes at his university, with the goal of comparing the heights of the two groups. His summary statistics are displayed in the provided table.
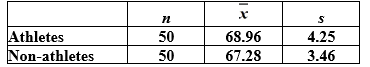 -Construct a 99% confidence interval for the difference in mean heights between student athletes and non-athletes at this university. Use two decimal places in your margin of error.
(Multiple Choice)
4.8/5 (41)
Use the following to answer the questions below:
In May 2012 President Obama made history by revealing his support of gay marriage. Around that time the Gallup Organization polled 1,024 U.S. adults about their opinions on gay/lesbian relations and gay marriage. They found that 54% of those sampled viewed gay/lesbian relations as "morally acceptable."
-Verify that the sample size is large enough to use the normal distribution to construct a confidence interval for the proportion of U.S. adults who consider gay and lesbian relations to be "morally acceptable."
(Essay)
4.8/5 (43)
Use the following to answer the questions below:
For each of the following, assume that the sample is a random sample from a distribution that is reasonably normally distributed and that we are doing inference for a population mean.
-Find endpoints of a t-distribution with 2.5% beyond them in each tail if the sample has size 
(Multiple Choice)
4.9/5 (37)
Use the following to answer the questions below:
In a given year, the average score on the Mathematics portion of the ACT for males was 21.3 with standard deviation 5.3. The average score on the Mathematics portion of the ACT for females was 20.2 with standard deviation 4.8.
-What effect does increasing the sample sizes have on the center of the distribution?
(Multiple Choice)
4.8/5 (45)
Use the following to answer the questions below:
In a Gallup survey of 1,012 randomly selected U.S. adults (age 18 and over), 53% said that they were dissatisfied with the quality of education students receive in kindergarten through grade 12.
-Construct a 90% confidence interval for the proportion of U.S. adults who are dissatisfied with the quality of education students receive in kindergarten through grade 12. Use three decimal places in your margin of error.
(Multiple Choice)
4.8/5 (33)
Use the following to answer the questions below:
A 1997 study described in the European Journal of Clinical Nutrition compares the growth of vegetarian and omnivorous children, ages 7 - 11, in Northwest England. In the study, each of the 50 vegetarian children in the study was matched with an omnivorous child of the same age with similar demographic characteristics. One of the aspects on which the children were compared was their body mass index (BMI). The differences in BMI for each pair of children (one vegetarian and one omnivore) was computed as vegetarian BMI minus omnivore BMI.
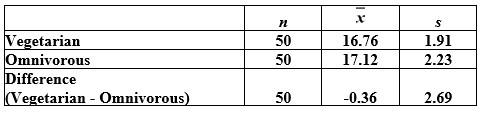 -Construct a 96% confidence interval for
  -
-  using the paired data in the following table. Round all values to three decimal places.
 Assume that the results come from random samples from populations that are approximately normal and that the differences are computed using
(Multiple Choice)
4.8/5 (31)
Use the following information to answer the confidence interval for a population proportion p in the questions below.
-0.655 to 0.685
What  is the best estimate of p?
(Multiple Choice)
5.0/5 (35)
Use the following to answer the questions below:
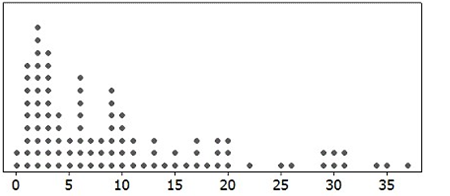
A dotplot and the summary statistics for a sample are provided. In each case, indicate whether or not it is appropriate to use the t-distribution.
-n = 100;  = 9.93; s = 9.247
(True/False)
4.8/5 (34)
Use the following to answer the questions below:
Zumba, often described as a Latin-inspired dance fitness party, is currently one of the most popular group fitness classes, but its health benefits have been little studied. An exercise science professor at a large university conducted a study to investigate some of the health benefits of Zumba. He recorded the weight of 9 female college students before they began a six week long Zumba program. As part of the program, they took a 60 minute long Zumba class three days a week. At the end of the program, the subjects were weighed again. Of interest is their weight loss, defined as weight before the program started minus weight after completing the program. The results are displayed in the following table.
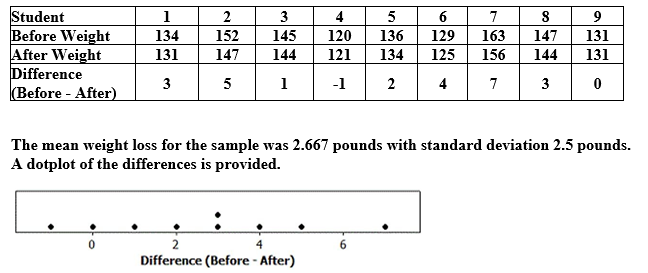 -Test, at the 1% level, if there is evidence that the Zumba program is effective for weight loss. Include all of the details of the test.
(Essay)
4.8/5 (36)
Use the following to answer the questions below:
Consider taking samples of size 100 from a population with proportion 0.33.
-Find the standard error of the distribution of sample proportions.
(Multiple Choice)
4.7/5 (38)
Use the following to answer the questions below:
In a survey, Gallup asked a random sample of U.S. adults if they would prefer to have a job outside the home, or if they would prefer to stay home to care for the family and home. Of the 504 males they surveyed, 391 said that they would prefer to have a job outside of the home. Of the 473 females they surveyed, 254 said that they would prefer a job outside of the home.
-Verify that the sample size is large enough in each group to use the normal distribution to construct a confidence interval for a difference in proportions.
(Essay)
4.9/5 (44)
Use the following to answer the questions below:
A study to investigate the dominant paws in cats was described in the scientific journal Animal Behaviour. The researchers used a random sample of 42 domestic cats. In this study, each cat was shown a treat (5 grams of tuna), and while the cat watched, the food was placed inside a jar. The opening of the jar was small enough that the cat could not stick its head inside to remove the treat. The researcher recorded the paw that was first used by the cat to try to retrieve the treat. This was repeated 100 times for each cat (over a span of several days). The paw used most often was deemed the dominant paw (note that one cat used both paws equally and was classified as "ambidextrous"). Of the 42 cats studied, 20 were classified as "left-pawed."
-Verify that the sample is large enough to use the normal formula to find a confidence interval for the proportion of domestic cats that are "left-pawed."
(True/False)
4.9/5 (39)
Use the following to answer the questions below:
In a given year, the average score on the Mathematics portion of the ACT for males was 21.3 with standard deviation 5.3. The average score on the Mathematics portion of the ACT for females was 20.2 with standard deviation 4.8.
-What effect does increasing the sample sizes have on the spread of the distribution?
(Multiple Choice)
4.8/5 (35)
Use the following to answer the questions below:
Suppose that the makers of M&M's claim that 24% of their Milk Chocolate M&M's are blue.
-Suppose you purchase a bag of Milk Chocolate M&M's from a vending machine and only 8 of your 55 candies are blue. Assuming that the sample proportions are normally distributed, what percent of vending machine bags (i.e., samples of size 55) will have a sample proportion smaller than 0.145? Use two decimal places when reporting your answer.
(Short Answer)
4.9/5 (32)
Use the following to answer the questions below:
In a given year, the average score on the Mathematics portion of the ACT for males was 21.3 with standard deviation 5.3. The average score on the Mathematics portion of the ACT for females was 20.2 with standard deviation 4.8.
-If random samples are taken with 50 males and 70 females, find the standard error of the distribution of differences in sample means,  where
where  and
and  represent the sample means for males and females, respectively. Report the standard error with four decimal places.
(Short Answer)
4.8/5 (29)
Use the following to answer the questions below:
On August 8, 2012, the national average price for a gallon of regular unleaded gasoline was $3.63. The prices for a random sample of gas stations in the state of Illinois were recorded at that time. The mean price for the sampled gas stations was $3.975, with standard deviation $0.2266. A boxplot of the data is provided.
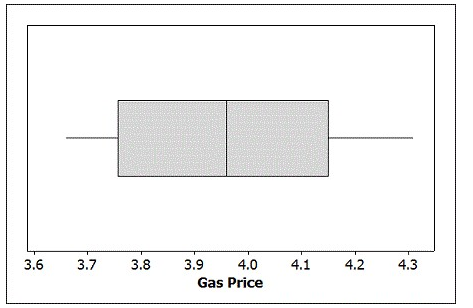 -Construct a 95% confidence interval for the mean gas price in Illinois (on August 8, 2012). Round your margin of error to three decimal places.
(Multiple Choice)
4.8/5 (30)
Use the following to answer the questions below:
The Gallup organization recently conducted a survey of 1,015 randomly selected U.S. adults about "Black Friday" shopping. They asked the following question:
"As you know, the Friday after Thanksgiving is one of the biggest shopping days of the year.
Looking ahead, do you personally plan on shopping on the Friday after Thanksgiving, or not?"
Of the 515 men who responded, 16% said "Yes." Of the 500 women who responded, 20% said "Yes."
-Construct a 95% confidence interval for the difference between the proportion of men and women who planned to shop on the Friday after Thanksgiving. Use three decimal places when computing the margin of error.
(Multiple Choice)
4.9/5 (38)
Use the following to answer the questions below:
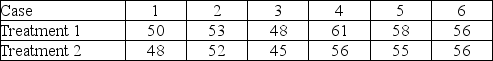
Students in a small statistics class were asked to count the number of scars both on their "dominant" hand (the one they use most often) and on their "off" hand. The summary statistics are provided. It is of interest to compare the average number of scars on the dominant and off hands.
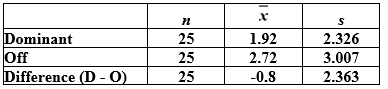 -Test to see if the mean number of scars on dominant hands is significantly different from the mean number of scars on off hands. Use a 10% significance level. Include all of the details of the test.
(Essay)
4.9/5 (54)
Filters
- Essay(0)
- Multiple Choice(0)
- Short Answer(0)
- True False(0)
- Matching(0)