Exam 6: Inference for Means and Proportions
Exam 1: Collecting Data68 Questions
Exam 2: Describing Data127 Questions
Exam 3: Confidence Intervals149 Questions
Exam 4: Hypothesis Tests117 Questions
Exam 5: Approximating With a Distribution74 Questions
Exam 6: Inference for Means and Proportions166 Questions
Exam 7: CHI-Square Tests for Categorical Variables45 Questions
Exam 8: Anova to Compare Means53 Questions
Exam 9: Inference for Regression123 Questions
Exam 10: Multiple Regression72 Questions
Select questions type
Use the following to answer the questions below:
In a recent study, the Centers for Disease Control and Prevention reported that in a sample of 4,349 African Americans 31% were Vitamin D deficient. Overall, it is believed that Vitamin D deficiency affects 8% of all U.S. adults.
-Verify that the sample size is large enough to use the normal distribution to construct a confidence interval for the proportion of African Americans with Vitamin D deficiency.
(Essay)
4.8/5  (38)
(38)
Use the following to answer the questions below:
In a survey conducted by the Gallup organization, 1,017 adults were asked "In general, how much trust and confidence do you have in the mass media - such as newspapers, TV, and radio - when it comes to reporting the news fully, accurately, and fairly?" Of the 1,017 respondents, 214 said they had "no confidence at all."
-Construct a 90% confidence interval for the proportion of U.S. adults who have no confidence in the media. Round the margin of error to three decimal places.
(Multiple Choice)
4.9/5 (39)
Use the following to answer the questions below:
Turkey is a staple at most traditional Thanksgiving dinners. A random sample of 12 grocery store customers were asked about the size of the turkey they were purchasing for Thanksgiving. The average weight was 13.9 pounds with a standard deviation of 2.2 pounds. The boxplot displays the distribution of the sample turkey weights.
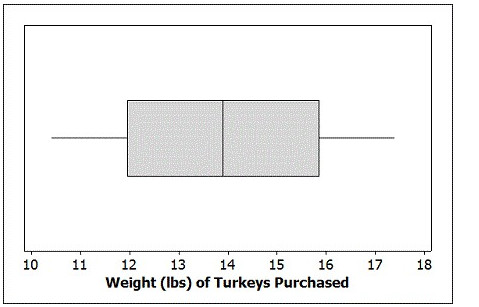 -Construct a 99% confidence interval for the average weight of turkeys purchased at this store. Provide an interpretation of your interval in the context of this data situation.
(Essay)
4.7/5 (40)
Use the following to answer the questions below:
According to a National Science Foundation study, individuals who graduated with a doctoral degree had an average of $14,115 graduate debt. Assume that the standard deviation of graduate debt is $26,400. If we take lots of samples of individuals who graduated with a doctoral degree, what would you expect the standard error of the distribution of sample mean graduate debt amounts to be in each case? In each case, use two decimal places when reporting your standard error.
-n = 500 individuals
(Short Answer)
4.9/5 (40)
Use the following to answer the questions below:
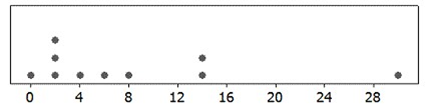
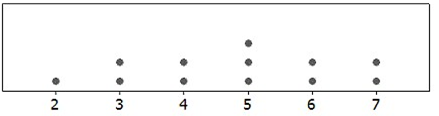
A dotplot and the summary statistics for a sample are provided. In each case, indicate whether or not it is appropriate to use the t-distribution.
-n = 10;  = 7.80; s = 9.28
(True/False)
4.8/5 (37)
Use the following to answer the questions below:
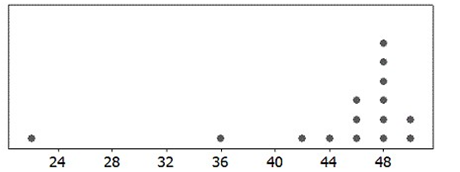
A dotplot and the summary statistics for a sample are provided. In each case, indicate whether or not it is appropriate to use the t-distribution.
-n = 15;  = 44; s = 7.32
(True/False)
4.8/5 (38)
Use the following information to answer the confidence interval for a population proportion p in the questions below.
-0.645 to 0.700
What is the margin of error?
(Multiple Choice)
4.7/5 (38)
Use the following to answer the questions below:
"Black Friday," which occurs annually the day after Thanksgiving, is one of the biggest shopping days of the year. During the holiday season, many stores created controversy by starting their mega-sales on Thanksgiving itself. In a random sample of 25 individuals who shopped during the Black Friday four-day weekend (Thursday - Sunday), the average amount spent was $399.40 with standard deviation $171.10. The data are displayed in the provided dotplot.
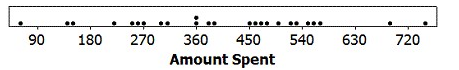 -Construct a 95% confidence interval for the average amount spent by individuals who shopped over the Black Friday weekend. Provide an interpretation of your interval in the context of this data situation.
(Essay)
4.8/5 (40)
Use the following to answer the questions below:
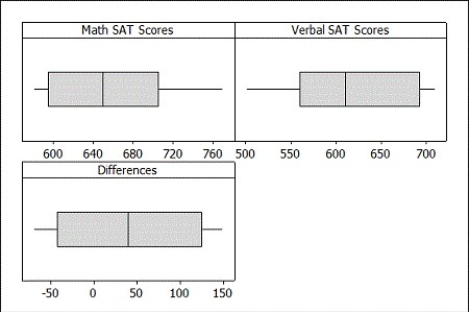
The Math and Verbal SAT scores for a random sample of 10 students from a large introductory statistics course are provided.
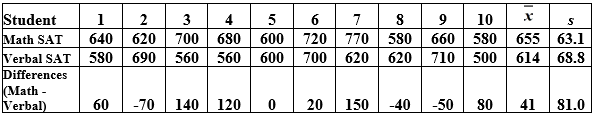 -Boxplots of the raw data are provided. Would it be appropriate to use a t-distribution to construct a confidence interval for, or perform a test about, the difference in the mean Math and Verbal SAT scores? Specifically mention which boxplot(s) you are using to justify your answer.
(Essay)
4.9/5 (34)
Use the following to answer the questions below:
Students in a large lecture class want to know who has, on average, more Facebook friends, male or female students. The data for the students are displayed in the provided dotplots and summary statistics are available in the provided table.
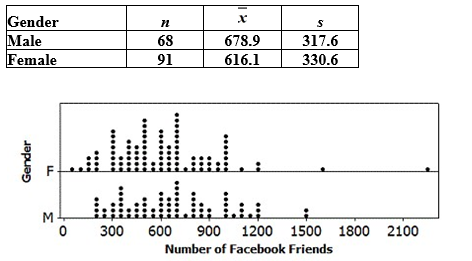 -Test, at the 5% level, if this sample provides evidence of a significant difference in the mean number of Facebook friends for male and female students at this university. Include all of the details of the test.
(Essay)
4.8/5 (41)
Use the following to answer the questions below:
Zumba, often described as a Latin-inspired dance fitness party, is currently one of the most popular group fitness classes, but its health benefits have been little studied. An exercise science professor at a large university conducted a study to investigate some of the health benefits of Zumba. He recorded the weight of 9 female college students before they began a six week long Zumba program. As part of the program, they took a 60 minute long Zumba class three days a week. At the end of the program, the subjects were weighed again. Of interest is their weight loss, defined as weight before the program started minus weight after completing the program. The results are displayed in the following table.
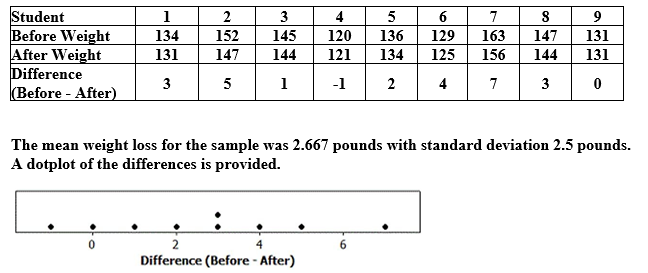 -Construct a 99% confidence interval for the mean weight loss. Use three decimal places in your margin of error.
(Multiple Choice)
4.7/5 (40)
Use the following to answer the questions below:
Consider taking random samples of size 30 from Population A with proportion 0.84 and random samples of size 60 from Population B with proportion 0.9.
-Find the standard error of the distribution of differences in sample proportions,  -
-  .
.
(Multiple Choice)
4.8/5 (36)
Use the following to answer the questions below:
A dotplot and the summary statistics for a sample are provided. In each case, indicate whether or not it is appropriate to use the t-distribution.
-n = 12;  = 4.75; s = 1.603
(True/False)
4.9/5 (43)
Use the following to answer the questions below:
Consider taking samples of size 25 from a population with proportion 0.65.
-Find the mean of the distribution of sample proportions.
(Multiple Choice)
4.9/5 (31)
Use the following to answer the questions below:
In a Gallup survey of 1,012 randomly selected U.S. adults (age 18 and over), 53% said that they were dissatisfied with the quality of education students receive in kindergarten through grade 12.
-Verify that the sample is large enough to use the normal formula to find a confidence interval for the proportion of Americans who are dissatisfied with the quality of education students receive in kindergarten through grade 12.
(Essay)
4.8/5 (36)
Use the following to answer questions 18-21:
In a survey of 7,786 randomly selected adults living in Germany, 5,840 said they exercised for at least 30 minutes three or more times per week.
-Construct a 99% confidence interval for the proportion of Germans who exercise for 30 minutes three or more times a week. Use three decimal places in your margin of error.
(Multiple Choice)
4.9/5 (40)
Use the following to answer the questions below:
Admissions records at a small university indicates that 6.7% of the students enrolled are international students.
-What proportion of samples of 200 randomly selected students will have at least 8% international students? Use three decimal places when reporting your answer.
(Short Answer)
4.9/5 (32)
Use the following to answer the questions below:
Many major television networks air coverage of the incoming election results during primetime hours. The provided boxplot displays the amount of time (in minutes) spent watching election coverage for a random sample of 25 U.S. adults. In this sample, the average time spent watching election coverage was 80.44 minutes with standard deviation of 43.99 minutes.
-Construct a 90% confidence interval for the average amount of time U.S. adults spent watching election coverage. Provide an interpretation of your interval in the context of this data situation.
(Essay)
4.8/5 (33)
Use the following to answer the questions below:
A certain species of tree has an average life span of 130 years. A researcher has noticed a large number of trees of this species washing up along a beach as driftwood. She takes core samples from 27 of those trees, selected at random, to count the number of rings and measure the widths of the rings. Counting the rings allows the researcher to determine the age of each tree. The mean age of the sampled driftwood is 119 years old, with standard deviation 46.92 years. The sample data are plotted in the provided dotplot. One of her interests is determining if this sample provides evidence that the average age of the driftwood is less than the 130 year life span expected for this type of tree. If the average age is less than 130 years it might suggest that the trees have died from unusual causes, such as invasive beetles or logging.
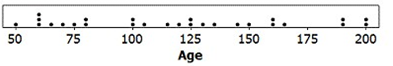 -Verify that it is reasonable to use the t-distribution to perform a test about the average age of driftwood along this beach.
(Essay)
4.8/5 (47)
Filters
- Essay(0)
- Multiple Choice(0)
- Short Answer(0)
- True False(0)
- Matching(0)