Exam 6: Inference for Means and Proportions
Exam 1: Collecting Data68 Questions
Exam 2: Describing Data127 Questions
Exam 3: Confidence Intervals149 Questions
Exam 4: Hypothesis Tests117 Questions
Exam 5: Approximating With a Distribution74 Questions
Exam 6: Inference for Means and Proportions166 Questions
Exam 7: CHI-Square Tests for Categorical Variables45 Questions
Exam 8: Anova to Compare Means53 Questions
Exam 9: Inference for Regression123 Questions
Exam 10: Multiple Regression72 Questions
Select questions type
Use the following to answer the questions below:
Consider taking random samples of size 100 from Population A with mean 85 and standard deviation of 15 and random samples of size 60 from Population B with mean 78 and standard deviation 12.
-Find the standard error of the distribution of differences in sample means, 
(Multiple Choice)
4.8/5  (28)
(28)
Use the following to answer the questions below:
"Black Friday," which occurs annually the day after Thanksgiving, is one of the biggest shopping days of the year. During the holiday season, many stores created controversy by starting their mega-sales on Thanksgiving itself. In a random sample of 25 individuals who shopped during the Black Friday four-day weekend (Thursday - Sunday), the average amount spent was $399.40 with standard deviation $171.10. The data are displayed in the provided dotplot.
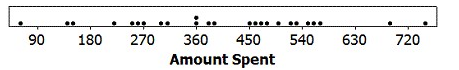 -Would the 95% confidence interval provide evidence that the average amount spent over the 2011 Black Friday weekend differs from the average amount spent over the 2012 Black Friday weekend?
(True/False)
4.8/5 (35)
Use the following to answer the questions below:
For each of the following, assume that the sample is a random sample from a distribution that is reasonably normally distributed and that we are doing inference for a population mean.
-Find the area in a t-distribution to the right of 2.6 if the sample has size 
(Short Answer)
4.7/5 (29)
Use the following to answer the questions below:
In a survey, Gallup asked a random sample of U.S. adults if they would prefer to have a job outside the home, or if they would prefer to stay home to care for the family and home. Of the 504 males they surveyed, 391 said that they would prefer to have a job outside of the home. Of the 473 females they surveyed, 254 said that they would prefer a job outside of the home.
-Test, at the 1% level, if there is evidence that the proportion of men who would prefer a job outside of the home is significantly higher than the proportion of women who would prefer a job outside of the home.
(Essay)
4.7/5 (44)
Use the following to answer the questions below:
Consider taking samples of size 100 from a population with proportion 0.33.
-Find the mean of the distribution of sample proportions.
(Multiple Choice)
4.8/5 (37)
Use the following to answer the questions below:
A random sample of 48 students at a large university reported getting an average of 7 hours of sleep on weeknights, with standard deviation 1.62 hours. A dotplot of the data is provided.
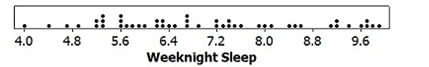 -Explain why it is reasonable to use a t-distribution to perform inference about the mean amount of weeknight sleep for students at this university.
(Essay)
4.9/5 (30)
Use the following to answer the questions below:
Turkey is a staple at most traditional Thanksgiving dinners. A random sample of 12 grocery store customers were asked about the size of the turkey they were purchasing for Thanksgiving. The average weight was 13.9 pounds with a standard deviation of 2.2 pounds. The boxplot displays the distribution of the sample turkey weights.
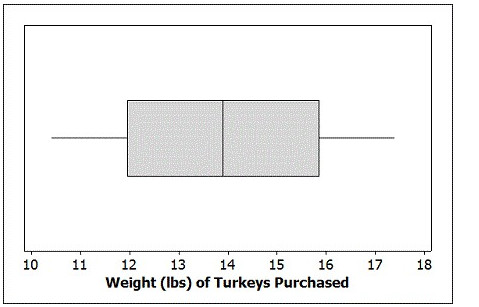 -Construct a 99% confidence interval for the average weight of turkeys purchased at this store. Round your margin of error to two decimal places.
(Multiple Choice)
4.8/5 (42)
Use the following to answer the questions below:
A professor with a large introductory statistics class noticed that nearly half of his students missed class the day before a long break (like Thanksgiving Break or Spring Break). He randomly called on students and found 10 students in attendance and 10 students who had skipped class. Later in his office, he examined the current course grades for the 20 students he had selected. A plot of his findings and summary statistics are provided. Note that the grades were entered as proportions, and thus a grade of 0.925 is a 92.5% in the course.
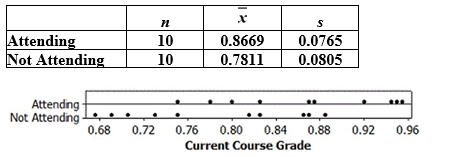 -Construct a 98% confidence interval for the difference between the mean grades for students attending and not attending class the day before break. Use four decimal places in your margin of error.
(Multiple Choice)
4.9/5 (32)
Use the following to answer the questions below:
An Internet provider contacts a random sample of 300 customers and asks how many hours per week the customers use the Internet. The responses are summarized in the provided dotplot. The average amount of time spent on the Internet per week was 7.2 hours, with a standard deviation of 7.9 hours.
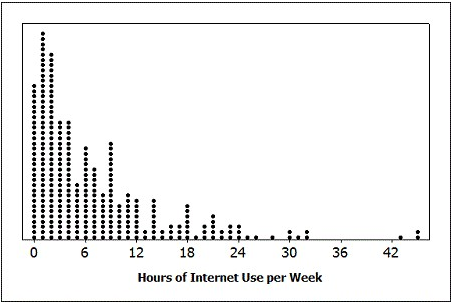 -Is it reasonable to use the t-distribution to construct a confidence interval for the average amount of time customers of this Internet provider spend on the Internet each week?
(True/False)
4.8/5 (37)
Use the following to answer the questions below:
"Black Friday," which occurs annually the day after Thanksgiving, is one of the biggest shopping days of the year. During the holiday season, many stores created controversy by starting their mega-sales on Thanksgiving itself. In a random sample of 25 individuals who shopped during the Black Friday four-day weekend (Thursday - Sunday), the average amount spent was $399.40 with standard deviation $171.10. The data are displayed in the provided dotplot.
-A natural question would be if more money was spent over the Black Friday weekend than over the previous year's Black Friday weekend (which did not start on Thursday). What information would be necessary to address this question using the paired data difference in means method? How could the data be collected so that the difference in means for two separate groups method would be most appropriate?
(Essay)
4.9/5 (28)
Use the following to answer the questions below:
For each of the following, assume that the sample is a random sample from a distribution that is reasonably normally distributed and that we are doing inference for a population mean.
-Find endpoints of a t-distribution with 1.5% beyond them in each tail if the sample has size 22.
(Multiple Choice)
4.8/5 (41)
Use the following to answer the questions below:
A study to investigate the dominant paws in cats was described in the scientific journal Animal Behaviour. The researchers used a random sample of 42 domestic cats. In this study, each cat was shown a treat (5 grams of tuna), and while the cat watched, the food was placed inside a jar. The opening of the jar was small enough that the cat could not stick its head inside to remove the treat. The researcher recorded the paw that was first used by the cat to try to retrieve the treat. This was repeated 100 times for each cat (over a span of several days). The paw used most often was deemed the dominant paw (note that one cat used both paws equally and was classified as "ambidextrous"). Of the 42 cats studied, 20 were classified as "left-pawed."
-Another researcher wants to conduct a similar study to more precisely estimate the proportion of cats that are "left-pawed." They want to construct a 95% confidence interval that has a margin of error of 6%. How many cats does she need to use in her sample?
(Multiple Choice)
4.7/5 (48)
Use the following to answer the questions below:
Situations comparing two proportions are described. In each case, determine whether the situation involves comparing proportions for two groups or comparing two proportions from the same group.
-Compare the proportion of U.S. adults who have a positive opinion about the media and the proportion of U.S. adults who have a negative opinion about the media.
(Multiple Choice)
4.9/5 (33)
Use the following to answer the questions below:
The owner of a small pet supply store wants to open a second store in another city, but he only wants to do so if more than one-third of the city's households have pets (otherwise there won't be enough business). He selects a random sample of 150 households and finds that 64 have pets.
-Verify that the sample size is large enough to use the normal distribution to construct a confidence interval for the proportion of the city's households that own pets.
(Essay)
4.9/5 (32)
Use the following to answer the questions below:
For each of the following, assume that the sample is a random sample from a distribution that is reasonably normally distributed and that we are doing inference for a population mean.
-Find the area in a t-distribution to the left of -0.68 if the sample has size 
(Short Answer)
4.9/5 (41)
Use the following to answer the questions below:
A random sample of 48 students at a large university reported getting an average of 7 hours of sleep on weeknights, with standard deviation 1.62 hours. A dotplot of the data is provided.
-It is recommended, for most college age students, to get 8 hours of sleep each night. Does this sample provide evidence, at the 5% level, that college students at this university get significantly less sleep, on average, than what is recommended? Include all of the details of the test.
(Essay)
4.8/5 (32)
Use the following to answer the questions below:
Consider taking random samples of size 50 from Population A with proportion 0.45 and random samples of size 40 from Population B with proportion 0.38.
-Are the sample sizes for both groups large enough for the Central Limit Theorem to apply so that the differences in sample proportions follow a normal distribution?
(True/False)
5.0/5 (34)
Use the following to answer the questions below:
In a recent study, the Centers for Disease Control and Prevention reported that in a sample of 4,349 African Americans 31% were Vitamin D deficient. Overall, it is believed that Vitamin D deficiency affects 8% of all U.S. adults.
-Test, at the 1% significance level, if this sample provides evidence that the rate of Vitamin D deficiency among African Americans differs significantly from the overall rate of 8%. Include all of the details of the test.
(Essay)
4.8/5 (39)
Use the following to answer the questions below:
Students in a large lecture class want to know who has, on average, more Facebook friends, male or female students. The data for the students are displayed in the provided dotplots and summary statistics are available in the provided table.
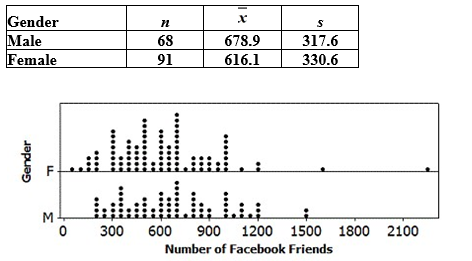 -Construct a 95% confidence interval for the difference in mean number of Facebook friends for male and female students at this university. Use two decimal places in your margin of error.
(Multiple Choice)
4.9/5 (33)
Use the following to answer the questions below:
In a survey, Gallup asked a random sample of U.S. adults if they would prefer to have a job outside the home, or if they would prefer to stay home to care for the family and home. Of the 504 males they surveyed, 391 said that they would prefer to have a job outside of the home. Of the 473 females they surveyed, 254 said that they would prefer a job outside of the home.
-Construct a 99% confidence interval for the difference between the proportion of men and women who would prefer to have a job outside the home. Use three decimal places when computing the sample proportions and margin of error.
(Multiple Choice)
4.8/5 (38)
Filters
- Essay(0)
- Multiple Choice(0)
- Short Answer(0)
- True False(0)
- Matching(0)