Exam 6: Inference for Means and Proportions
Exam 1: Collecting Data68 Questions
Exam 2: Describing Data127 Questions
Exam 3: Confidence Intervals149 Questions
Exam 4: Hypothesis Tests117 Questions
Exam 5: Approximating With a Distribution74 Questions
Exam 6: Inference for Means and Proportions166 Questions
Exam 7: CHI-Square Tests for Categorical Variables45 Questions
Exam 8: Anova to Compare Means53 Questions
Exam 9: Inference for Regression123 Questions
Exam 10: Multiple Regression72 Questions
Select questions type
Use the following to answer the questions below:
Many major television networks air coverage of the incoming election results during primetime hours. The provided boxplot displays the amount of time (in minutes) spent watching election coverage for a random sample of 25 U.S. adults. In this sample, the average time spent watching election coverage was 80.44 minutes with standard deviation of 43.99 minutes.
-Construct a 90% confidence interval for the average amount of time U.S. adults spent watching election coverage. Use two decimal places in your margin of error.
(Multiple Choice)
4.9/5  (41)
(41)
Use the following to answer the questions below:
Consider taking random samples of size 30 from Population A with proportion 0.84 and random samples of size 60 from Population B with proportion 0.9.
-Are the sample sizes for both groups large enough for the Central Limit Theorem to apply so that the differences in sample proportions follows a Normal distribution?
(True/False)
4.8/5 (43)
Use the following to answer the questions below:
A sample of 148 college students at a large university reports getting an average of 6.85 hours of sleep last night with a standard deviation of 2.12 hours.
-Is it reasonable to use the t-distribution to construct a confidence interval for the average amount of sleep students at this university got last night?
(True/False)
4.9/5 (45)
Use the following to answer the questions below:
"Black Friday," which occurs annually the day after Thanksgiving, is one of the biggest shopping days of the year. During the holiday season, many stores created controversy by starting their mega-sales on Thanksgiving itself. In a random sample of 25 individuals who shopped during the Black Friday four-day weekend (Thursday - Sunday), the average amount spent was $399.40 with standard deviation $171.10. The data are displayed in the provided dotplot.
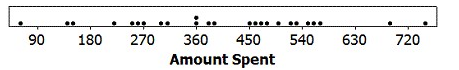 -Suppose we know that in a random sample of n = 22 individuals who shopped over Black Friday weekend in 2011 the average amount spent was $381.30 with standard deviation $119.80. Construct a 95% confidence interval for the difference in the mean amount spent between the 2012 and 2011 Black Friday weekends. Round the margin of error to two decimal places.
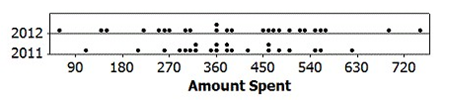
Recall that for the 2012 sample of 25 individuals, the average amount spent was $399.40 with standard deviation $171.10. Dotplots of both samples are provided.
-Suppose we know that in a random sample of n = 22 individuals who shopped over Black Friday weekend in 2011 the average amount spent was $381.30 with standard deviation $119.80. Construct a 95% confidence interval for the difference in the mean amount spent between the 2012 and 2011 Black Friday weekends. Round the margin of error to two decimal places.
Recall that for the 2012 sample of 25 individuals, the average amount spent was $399.40 with standard deviation $171.10. Dotplots of both samples are provided.
(Multiple Choice)
4.8/5 (33)
Use the following to answer the questions below:
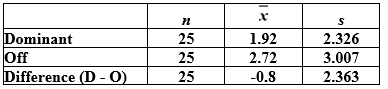
Students in a small statistics class were asked to count the number of scars both on their "dominant" hand (the one they use most often) and on their "off" hand. The summary statistics are provided. It is of interest to compare the average number of scars on the dominant and off hands.
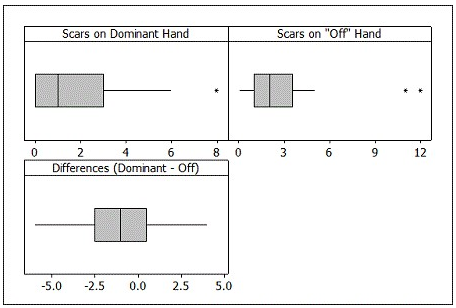
 -Boxplots of the raw data are provided. Would it be appropriate to use a t-distribution to construct a confidence interval for, or perform a test about, the difference in the mean number of scars on dominant and off hands? Specifically mention which boxplot(s) you are using to justify your answer.
(Essay)
4.7/5 (47)
Filters
- Essay(0)
- Multiple Choice(0)
- Short Answer(0)
- True False(0)
- Matching(0)