Exam 3: Relationships Between Quantitative Variables
Exam 1: Statistics Success Stories and Cautionary Tales79 Questions
Exam 2: Turning Data Into Information94 Questions
Exam 3: Relationships Between Quantitative Variables99 Questions
Exam 4: Relationships Between Categorical Variables100 Questions
Exam 5: Sampling: Surveys and How to Ask Questions109 Questions
Exam 6: Gathering Useful Data for Examining Relationships90 Questions
Exam 7: Probability112 Questions
Exam 8: Random Variables115 Questions
Exam 9: Understanding Sampling Distributions: Statistics As Random Variables231 Questions
Exam 10: Estimating Proportions With Confidence104 Questions
Exam 11: Estimating Means With Confidence103 Questions
Exam 12: Testing Hypotheses About Proportions139 Questions
Exam 13: Testing Hypotheses About Means166 Questions
Exam 14: Inference About Simple Regression115 Questions
Exam 15: More About Inference for Categorical Variables111 Questions
Exam 16: Analysis of Variance111 Questions
Exam 17: Turning Information Into Wisdom70 Questions
Select questions type
Use the following information for questions:
A group of adults aged 20 to 80 were tested to see how far away they could first hear an ambulance coming towards them. An equation describing the relationship between distance (in feet) and age was found to be:
Distance = 600 - 3 * Age.
-Estimate the distance for an individual who is 20 years old.
(Multiple Choice)
4.9/5  (24)
(24)
Use the following information for questions:
The next two questions are based on a regression equation for 55 college students withx = left forearm length (cm) and y = height. The forearm lengths ranged from 22 cm to 31 cm. The regression equation is = 30.3 + 1.49x.
-What is the correlation between left forearm length and height?
(Short Answer)
4.8/5 (32)
Use the following information for questions:
Past data has shown that the regression line relating the final exam score and the midterm exam score for students who take statistics from a certain professor is:
final exam = 50 + 0.5 * midterm
-Midterm exam scores could range from 0 to 100. Based on the equation, final exam scores are predicted to range from
(Multiple Choice)
4.8/5 (34)
A scatterplot of X and Y is shown below. Which value of the correlation coefficient, r, best describes the relationship? 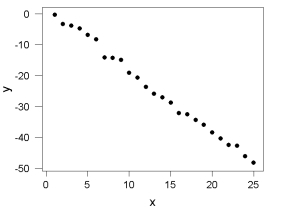
(Multiple Choice)
4.8/5 (38)
In an attempt to model the relationship between sales price and assessed land value, a realtor has taken a simple random sample of houses recently sold in the area and obtained the following data (both are expressed in thousands of dollars). The scatterplot below shows the association between fuel capacity and fuel efficiency for a sample of 78 cars. Is the association negative or positive? Linear or curvilinear? Are there any outliers?
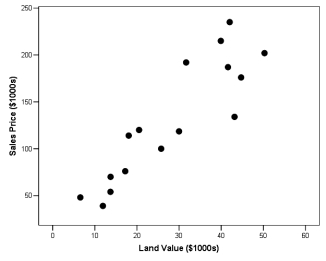
(Essay)
4.7/5 (40)
A survey of students found a negative correlation between the weekly hours of T.V. watched and the weekly hours spent exercising. One student explained that reducing the hours of T.V. watched (cause) would result in students sleeping longer and having more energy to exercise (effect). Give another explanation with hours of exercise as the cause and hours T.V. watched as the effect.
(Short Answer)
4.9/5 (45)
A regression line is a straight line that describes how values of a quantitative explanatory variable (y) are related, on average, to values of a quantitative response variable (x).
(True/False)
4.8/5 (39)
The following plot shows the association between weight (pounds) and age (months) for 19 female bears. Write an interpretation of this plot. Is the association negative or positive? Linear or curvilinear? Are there any outliers?
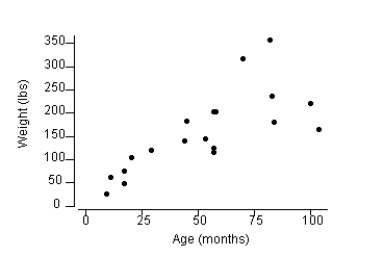
(Essay)
4.7/5 (40)
Use the following information for questions:
A regression was done for 20 cities with latitude as the explanatory variable (x) and average January temperature as the response variable (y). The latitude is measured in degrees and average January temperature in degrees Fahrenheit. The latitudes ranged from 26 (Miami) to 47 (Duluth) The regression equation is = 49.4 - 0.313x
-Mexico City has latitude 20 degrees. What is the problem with using the regression equation to estimate the average January temperature for Mexico City?
(Short Answer)
4.9/5 (34)
The scatterplot below shows student heights (y axis) versus father's heights (x axis) for a sample of 173 college students. The symbol "+" represents a male student and the symbol "o" is represents a female student.
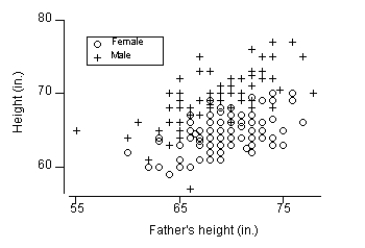 Based on the scatterplot, what is the problem with using a regression equation for all 173 students?
(Short Answer)
4.8/5 (38)
Use the following information for questions:
The next two questions are based on a regression equation for 55 college students withx = left forearm length (cm) and y = height. The forearm lengths ranged from 22 cm to 31 cm. The regression equation is = 30.3 + 1.49x.
-The total sum of squares (SSTO) = 1054.8, and the error sum of squares (SSE) = 464.5. What is the value of r2, the proportion of variation in y explained by its linear relationship with x?
(Short Answer)
4.8/5 (34)
Use the following information for questions:
A graduate student is doing a research project on stress among recent immigrants. She focused on parents of young children. All parents answered questions on a questionnaire (with the help of a translator if necessary). A stress score was calculated for all participants. SPSS was used to run a simple linear regression in which y = stress of the parent and x = age of the parent.
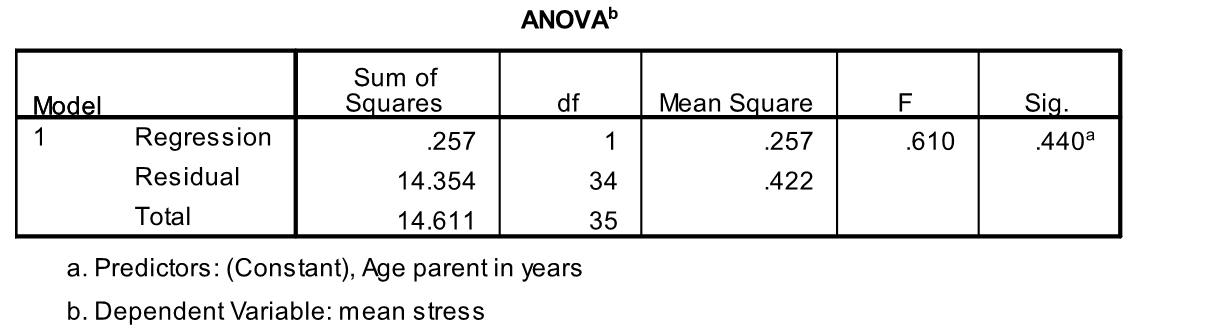
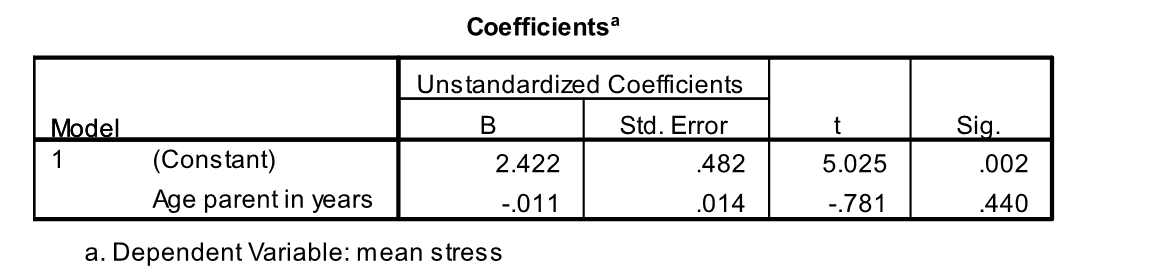 -A least squares line or least squares regression line has the property that the sum of squared differences between the observed values of y and the predicted values is smaller for that line than it is for any other line. What is the value of the SSE for this regression line?
(Multiple Choice)
4.9/5 (39)
Use the following information for questions:
The simple linear regression equation can be written as = +
-In the simple linear regression equation, the term represents the
(Multiple Choice)
4.8/5 (32)
Describe the type of association shown in the scatterplot below: 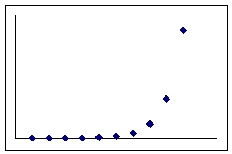
(Multiple Choice)
4.9/5 (31)
Based on 1988 census data for the 50 States in the United States, the correlation between the number of churches per state and the number of violent crimes per state was 0.85. What can we conclude?
(Multiple Choice)
4.8/5 (34)
Use the following information for questions:
A regression between foot length (response variable in cm) and height (explanatory variable in inches) for 33 students resulted in the following regression equation: = 10.9 + 0.23x
-One student in the sample was 73 inches tall with a foot length of 29 cm. What is the predicted foot length for this student?
(Multiple Choice)
4.8/5 (29)
A regression line can be used to estimate the average value of y at any specified value of x.
(True/False)
4.8/5 (41)
Filters
- Essay(0)
- Multiple Choice(0)
- Short Answer(0)
- True False(0)
- Matching(0)