Exam 3: Relationships Between Quantitative Variables
Exam 1: Statistics Success Stories and Cautionary Tales79 Questions
Exam 2: Turning Data Into Information94 Questions
Exam 3: Relationships Between Quantitative Variables99 Questions
Exam 4: Relationships Between Categorical Variables100 Questions
Exam 5: Sampling: Surveys and How to Ask Questions109 Questions
Exam 6: Gathering Useful Data for Examining Relationships90 Questions
Exam 7: Probability112 Questions
Exam 8: Random Variables115 Questions
Exam 9: Understanding Sampling Distributions: Statistics As Random Variables231 Questions
Exam 10: Estimating Proportions With Confidence104 Questions
Exam 11: Estimating Means With Confidence103 Questions
Exam 12: Testing Hypotheses About Proportions139 Questions
Exam 13: Testing Hypotheses About Means166 Questions
Exam 14: Inference About Simple Regression115 Questions
Exam 15: More About Inference for Categorical Variables111 Questions
Exam 16: Analysis of Variance111 Questions
Exam 17: Turning Information Into Wisdom70 Questions
Select questions type
A regression analysis done with Minitab for left foot length (y variable) and right foot length (x variable) for 55 college students gave the following output. 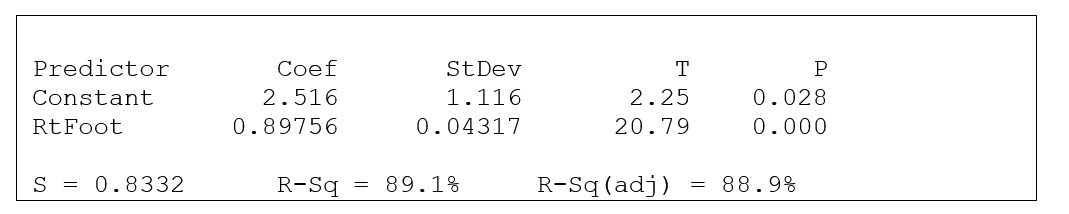 The regression equation for left foot length (y variable) and right foot length (x variable) is
(Multiple Choice)
4.7/5  (39)
(39)
Use the following information for questions:
A regression was done for 20 cities with latitude as the explanatory variable (x) and average January temperature as the response variable (y). The latitude is measured in degrees and average January temperature in degrees Fahrenheit. The latitudes ranged from 26 (Miami) to 47 (Duluth) The regression equation is = 49.4 - 0.313x.
-What is the value of the correlation coefficient r?
(Short Answer)
4.8/5 (37)
A researcher reports that the correlation between two quantitative variables is r = 0.8. Which of the following statements is correct?
(Multiple Choice)
4.8/5 (36)
Use the following information for questions:
The 25 item "Parenting Hassles Scale" asks parents questions about certain situations in their family. They are asked to rate these situations on (1) how often they occur (frequency), and (2) how much they bother them (intensity). The score system for the frequency was 0-4 points (0 = never, 4 = all the time) and for the intensity 1-5 (1 = not much at all, 5 = very much). If an item received a 0 (zero) for frequency, it automatically received a 0 (zero) for intensity. The two variables, frequency and intensity, were formed by taking the total of the corresponding scores from the two rating scales across the various situations. In a scatterplot, these two variables showed an approximate linear relationship. They were then used to run a linear regression to predict intensity based on frequency.
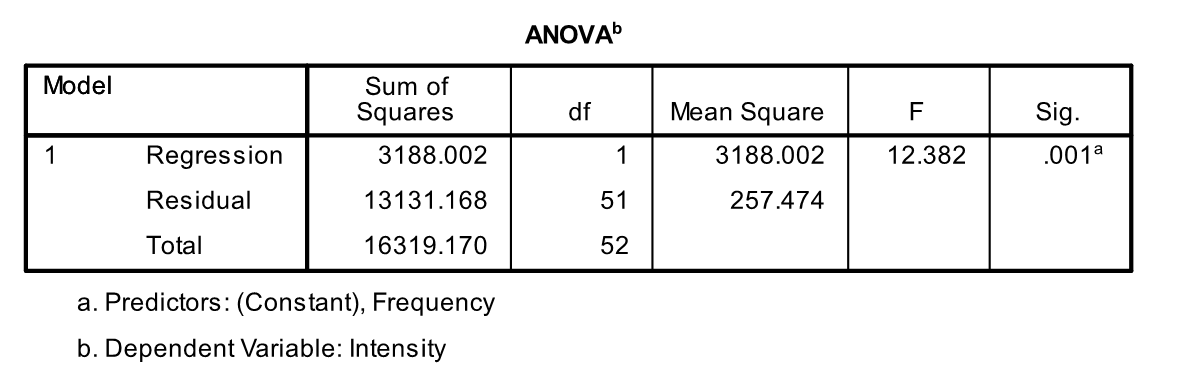
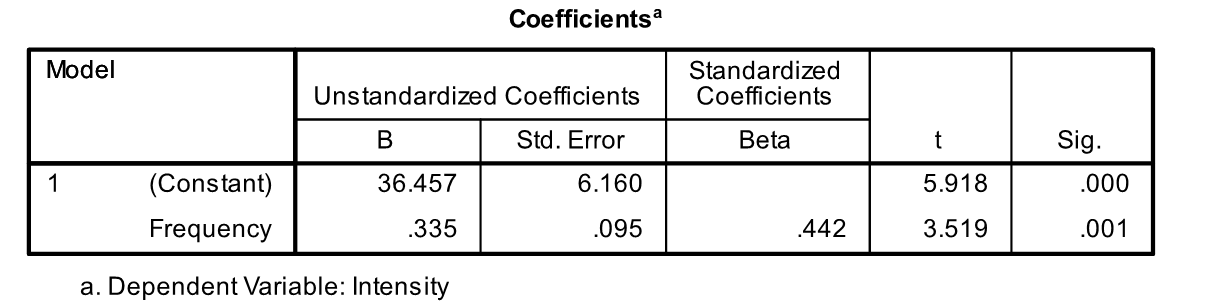 -Dan filled out the "Parenting Hassles Scale". He scored 25 on the frequency scale and 41 on the intensity scale. What is the value of Dan's residual?
(Short Answer)
4.8/5 (30)
The correlation between father's heights and student's heights for a sample of 79 male students is r = 0.669. What is the proportion of variation in son's heights explained by the linear relationship with father's heights?
(Short Answer)
4.9/5 (31)
A scatterplot of the self-reported weights (y variable) and self-reported heights (x variable) for 176 college students follows. 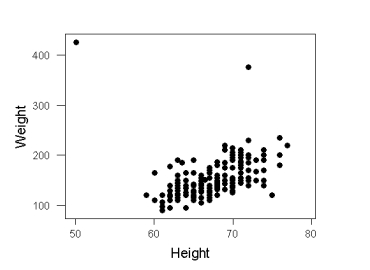 What is the main difficulty with using a regression line to analyze these data?
(Multiple Choice)
4.8/5 (37)
Use the following information for questions:
The next three questions are based on a regression equation for 55 college students with x = left forearm length (cm) and y = height. The forearm lengths ranged from 22 cm to 31 cm. The regression equation is = 30.3 + 1.49x
-One student's left forearm length was 22 cm, and her height was 63 inches. What is the estimated height for this student, based on the regression equation? What is the residual?
(Short Answer)
4.8/5 (23)
For which one of these relationships could we use a regression analysis? Only one choice is correct.
(Multiple Choice)
4.8/5 (43)
Use the following information for questions:
A regression was done for 20 cities with latitude as the explanatory variable (x) and average January temperature as the response variable (y). The latitude is measured in degrees and average January temperature in degrees Fahrenheit. The latitudes ranged from 26 (Miami) to 47 (Duluth) The regression equation is = 49.4 - 0.313x
-The city of Miami, Florida has latitude 26 degrees with average January temperature of 67 degrees Fahrenheit. What is the estimated average January temperature for Miami, based on the regression equation? What is the residual?
(Short Answer)
4.9/5 (31)
Use the following information for questions:
Past data has shown that the regression line relating the final exam score and the midterm exam score for students who take statistics from a certain professor is:
final exam = 50 + 0.5 * midterm
-What is the predicted final exam score for a student with a midterm score of 50?
(Multiple Choice)
4.8/5 (32)
Which one of the following is not appropriate for studying the relationship between two quantitative variables?
(Multiple Choice)
4.8/5 (31)
Use the following information for questions:
Consider the following scatterplots for two quantitative variables y and x. One point has been labeled in each plot.
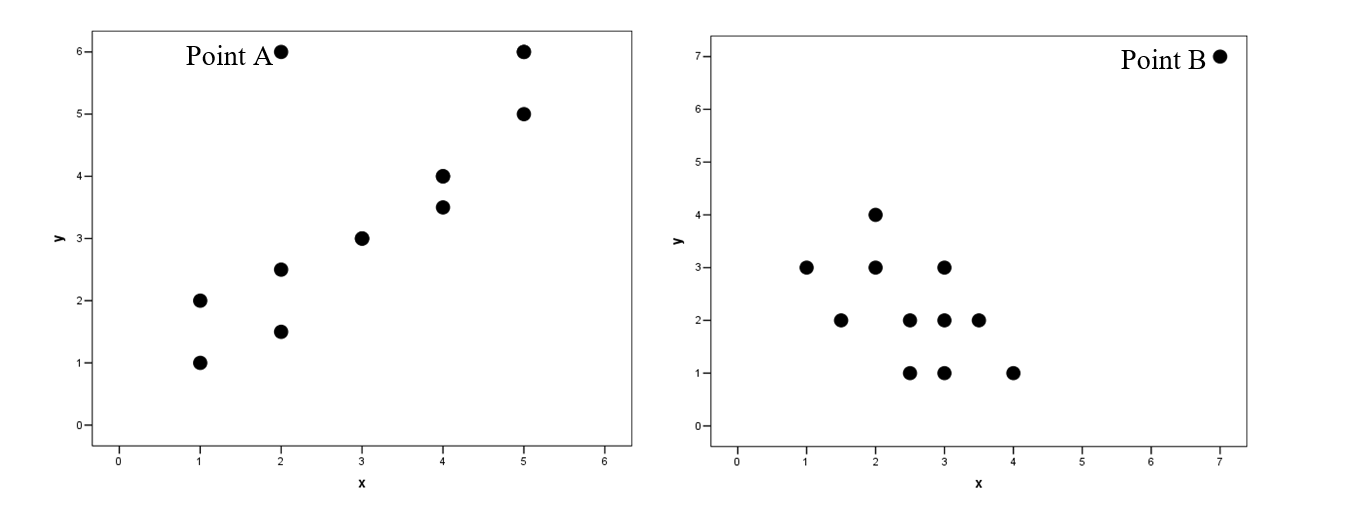 -Which point would be the most influential?
(Multiple Choice)
4.9/5 (36)
A professor found a negative correlation between the number of hours students came to her office hours and their score on her final exam. What possible confounding variable could explain the observed negative correlation?
(Short Answer)
4.8/5 (38)
Which of the following correlation values indicates the strongest linear relationship between two quantitative variables?
(Multiple Choice)
4.7/5 (35)
A researcher would like to study the relationship between y = graduating GPA of students at a university and x = major field of study (1 = science, 2 = humanities, etc.). What is a possible difficulty with using a regression line to analyze these data?
(Multiple Choice)
4.9/5 (24)
A scatterplot of the price of a book (y variable) versus the number of pages in the book (x variable) is shown for 15 books in a professors office. In addition, the symbol "o" shows that the book was a hardcover book, while the symbol "+" shows that the book was a softcover book. 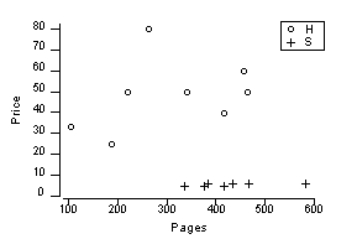 What is the main difficulty with using a regression line to analyze these data?
(Multiple Choice)
4.9/5 (38)
Use the following information for questions:
Past data has shown that the regression line relating the final exam score and the midterm exam score for students who take statistics from a certain professor is:
final exam = 50 + 0.5 * midterm
-Which of the following gives a correct interpretation of the intercept?
(Multiple Choice)
4.8/5 (26)
Which one of the following cannot be determined from a scatterplot?
(Multiple Choice)
4.9/5 (43)
A regression line can be used to predict the unknown value of x for an individual, given that individual's y value.
(True/False)
4.8/5 (42)
Filters
- Essay(0)
- Multiple Choice(0)
- Short Answer(0)
- True False(0)
- Matching(0)