Exam 23: Circulation
Exam 1: Biology: Exploring Life48 Questions
Exam 2: The Chemical Basis of Life72 Questions
Exam 3: The Molecules of Cells85 Questions
Exam 4: A Tour of the Cell90 Questions
Exam 5: The Working Cell80 Questions
Exam 6: How Cells Harvest Chemical Energy82 Questions
Exam 7: Photosynthesis: Using Light to Make Food81 Questions
Exam 8: The Cellular Basis of Reproduction and Inheritance78 Questions
Exam 9: Patterns of Inheritance77 Questions
Exam 10: Molecular Biology of the Gene82 Questions
Exam 11: How Genes Are Controlled81 Questions
Exam 12: DNA Technology and Genomics78 Questions
Exam 13: How Populations Evolve64 Questions
Exam 14: The Origin of Species58 Questions
Exam 15: Tracing Evolutionary History82 Questions
Exam 16: Microbial Life: Prokaryotes and Protists84 Questions
Exam 17: The Evolution of Plant and Fungal Diversity79 Questions
Exam 18: The Evolution of Invertebrate Diversity72 Questions
Exam 19: The Evolution of Vertebrate Diversity72 Questions
Exam 20: Unifying Concepts of Animal Structure and Function63 Questions
Exam 21: Nutrition and Digestion91 Questions
Exam 22: Gas Exchange66 Questions
Exam 23: Circulation77 Questions
Exam 24: the Immune System79 Questions
Exam 25: Control of Body Temperature and Water Balance63 Questions
Exam 26: Hormones and the Endocrine System60 Questions
Exam 27: Reproduction and Embryonic Development71 Questions
Exam 28: Nervous Systems70 Questions
Exam 29: the Senses60 Questions
Exam 30: How Animals Move69 Questions
Exam 31: Plant Structure, Growth, and Reproduction79 Questions
Exam 32: Plant Nutrition and Transport65 Questions
Exam 33: Control Systems in Plants58 Questions
Exam 34: the Biosphere: an Introduction to Earths Diverse Environments63 Questions
Exam 35: Behavioral Adaptations to the Environment52 Questions
Exam 36: Population Ecology53 Questions
Exam 37: Communities and Ecosystems60 Questions
Exam 38: Conservation Biology57 Questions
Select questions type
Bone marrow stem cells are sometimes used to treat certain blood cell diseases, such as
Free
(Multiple Choice)
4.8/5  (37)
(37)
Correct Answer: Verified
A
Which part of this figure depicts an arteriole? 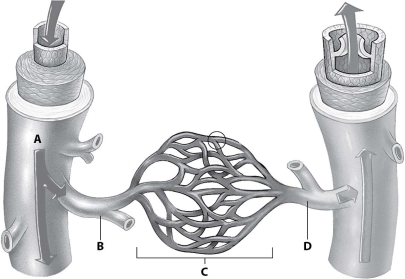
Free
(Multiple Choice)
4.8/5 (36)
Correct Answer:Verified
B
During exercise, your heart rate can increase dramatically in order to meet the metabolic demands of your tissues. If your heart rate increased to 144 beats per minute, approximately how long would diastole last?
Free
(Multiple Choice)
5.0/5 (30)
Correct Answer:Verified
C
Which of the following is a function of the circulatory system?
(Multiple Choice)
4.8/5 (36)
After reading the paragraph below, answer the questions that follow.
Ron and Tiffany are studying circulatory system function. They designed an experiment to test whether the diameter of a tube affects the rate of flow through the tube. In their experiment, they ran water from a large container through five tubes with different diameters for exactly 30 seconds for each tube. They measured the volume of liquid that passed through the tube during the 30-second period, testing each tube three times and pouring the water back into the container after each test. The results of the experiment are shown in the following table.
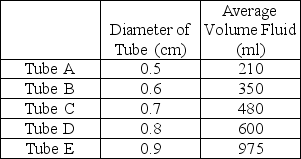 -Ron and Tiffany modified the experiment to see how long it would take to pass 1,000 mL of fluid through each tube. Based on these results shown in the table, which tube would it take the longest for 1,000 mL of fluid to flow through?
(Multiple Choice)
4.8/5 (29)
In which of the following human blood vessels is the blood pressure lowest?
(Multiple Choice)
4.8/5 (36)
A red blood cell is in an artery in the right leg. How many capillary beds will it pass through before it returns to the left atrium of the heart?
(Multiple Choice)
4.8/5 (41)
From the left ventricle, oxygen-rich blood flows through the
(Multiple Choice)
4.8/5 (30)
Which of the following is the cause of more than half of all deaths in the United States?
(Multiple Choice)
4.9/5 (39)
In mammals, blood returning from the head will pass through the ________ just before entering the right atrium.
(Multiple Choice)
4.9/5 (32)
Ventricular contraction normally begins at the apex (bottom of the heart). What would likely happen if ventricular contraction originated at the intersection of the atria and the ventricles instead?
(Multiple Choice)
4.8/5 (35)
Adaptation to terrestrial life involved major evolutionary changes. The change from gill breathing to lung breathing was accompanied by important changes in the
(Multiple Choice)
4.7/5 (33)
After reading the paragraphs below, answer the questions that follow.
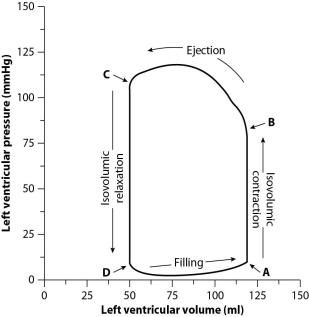
To evaluate cardiac function, scientists and physicians measure both the pressure and the volume inside the heart. When both pressure and volume data are plotted on the same graph, the resulting graph is called a pressure-volume loop. To create a pressure-volume loop, a catheter (a thin tube) is inserted into the vessels of the heart, and measurements of both left ventricular pressure and left ventricular volume are taken. The data are plotted on a graph, and cardiac function can then be evaluated from the distribution of the data and the shape of the loop.
The figure below shows a typical left ventricle pressure-volume loop for a healthy young adult. The cardiac cycle proceeds counterclockwise. Each complete turn around the loop (for example, starting at point A and ending back at point A) represents one complete cardiac cycle.
 -Aortic stenosis is a disease in which the aortic valve (the semilunar valve between the left ventricle and the aorta)narrows, resulting in increased left ventricular pressure and reduced ejection volume (the amount of blood that the left ventricle ejects). What would the pressure-volume graph for a patient with aortic stenosis look like compared to the graph shown above for a healthy young adult?
(Multiple Choice)
4.7/5 (32)
After reading the paragraphs below, answer the questions that follow.
To evaluate cardiac function, scientists and physicians measure both the pressure and the volume inside the heart. When both pressure and volume data are plotted on the same graph, the resulting graph is called a pressure-volume loop. To create a pressure-volume loop, a catheter (a thin tube) is inserted into the vessels of the heart, and measurements of both left ventricular pressure and left ventricular volume are taken. The data are plotted on a graph, and cardiac function can then be evaluated from the distribution of the data and the shape of the loop.
The figure below shows a typical left ventricle pressure-volume loop for a healthy young adult. The cardiac cycle proceeds counterclockwise. Each complete turn around the loop (for example, starting at point A and ending back at point A) represents one complete cardiac cycle.
-How much blood is ejected from the left ventricle during one contraction?
(Multiple Choice)
4.9/5 (36)
Although birds and mammals descended from different ancestors, they both have a four-chambered heart. This is the result of
(Multiple Choice)
4.9/5 (27)
Which of the following animals has a single circuit of blood flow and two heart chambers?
(Multiple Choice)
4.7/5 (35)
Filters
- Essay(0)
- Multiple Choice(0)
- Short Answer(0)
- True False(0)
- Matching(0)