Exam 16: Time-Series Analysis and Forecasting
Exam 1: Describing Data: Graphical247 Questions
Exam 2: Describing Data: Numerical326 Questions
Exam 3: Probability345 Questions
Exam 4: Discrete Random Variables and Probability Distributions257 Questions
Exam 5: Continuous Random Variables and Probability Distributions239 Questions
Exam 6: Sampling and Sampling Distributions147 Questions
Exam 7: Estimation: Single Population151 Questions
Exam 8: Estimation: Additional Topics109 Questions
Exam 9: Hypothesis Testing: Single Population164 Questions
Exam 10: Hypothesis Testing: Additional Topics103 Questions
Exam 11: Simple Regression217 Questions
Exam 12: Multiple Regression252 Questions
Exam 13: Additional Topics in Regression Analysis168 Questions
Exam 14: Analysis of Categorical Data241 Questions
Exam 15: Analysis of Variance192 Questions
Exam 16: Time-Series Analysis and Forecasting138 Questions
Exam 17: Additional Topics in Sampling110 Questions
Select questions type
THE NEXT QUESTIONS ARE BASED ON THE FOLLOWING INFORMATION:
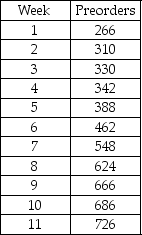
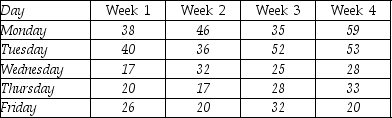
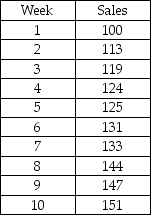
The table below is the data set of the number of preorders received for a particular game on a weekly basis.
The forecaster uses the Holt-Winters Exponential Smoothing for nonseasonal series to forecast the number of preorders in future time periods.
He uses α = 0.8 and β = 0.5.(Hint: Use the formula from the text to arrive at the answers. )
 -What is initial estimate of the trend value for week 2?
(Multiple Choice)
4.8/5  (24)
(24)
THE NEXT QUESTIONS ARE BASED ON THE FOLLOWING INFORMATION:
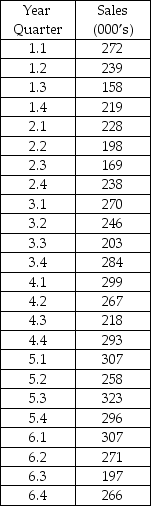
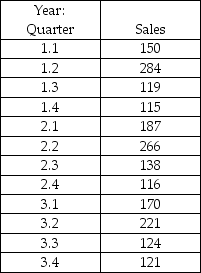
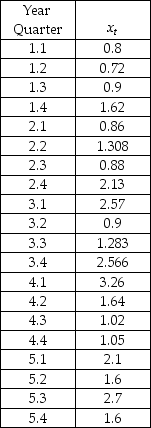
The table below shows the quarterly sales of a particular kind of vaccine for dogs.The forecaster uses autoregressive models with p = 3 to forecast the sales for future time periods.
 -The number of forecast values determined is:
(Multiple Choice)
4.9/5 (31)
THE NEXT QUESTIONS ARE BASED ON THE FOLLOWING INFORMATION:
The table below is the data set of the number of preorders received for a particular game on a weekly basis.
The forecaster uses the Holt-Winters Exponential Smoothing for nonseasonal series to forecast the number of preorders in future time periods.
He uses α = 0.8 and β = 0.5.(Hint: Use the formula from the text to arrive at the answers. )
-What is the trend estimate for week 10?
(Multiple Choice)
4.7/5 (27)
THE NEXT QUESTIONS ARE BASED ON THE FOLLOWING INFORMATION:
The table below is the data set of the Shiller Real Home Price Index for the years 1934-1944.
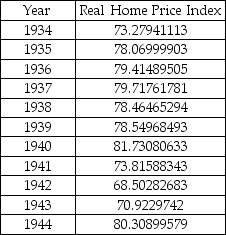 -Consider the following time-series data.Develop the simple centered 5-point moving average for this series.
(Essay)
4.9/5 (38)
THE NEXT QUESTIONS ARE BASED ON THE FOLLOWING INFORMATION:
The daily sales figures shown below have been recorded in a medium size insurance
company.
 -The data values in the table below show an index of food prices,seasonally adjusted,over a period of 14 months in Germany.

 Use the Holt-Winters method with smoothing constants α = 0.5 and β =0.5 to obtain forecasts for the next 3 months.
(Essay)
4.8/5 (47)
THE NEXT QUESTIONS ARE BASED ON THE FOLLOWING INFORMATION:
The table below shows the quarterly sales of a gifting store.The forecaster uses the Holt-Winters multiplicative model to determine the forecast for future periods.
Given: α = 0.6,β = 0.5,and γ = 0.4.
 -Calculate the value of the mean absolute percentage error.
(Multiple Choice)
4.9/5 (42)
THE NEXT QUESTIONS ARE BASED ON THE FOLLOWING INFORMATION:
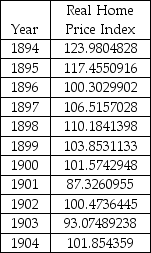
The table below is the data set of the Shiller Real Home Price Index for the years 1894-1904.
Use a smoothing constant of α = 0.8 to determine the forecasts using simple exponential smoothing.
 -Calculate the forecast value for the year 1905,if the real home price index for that year is 98.056.
(Multiple Choice)
4.8/5 (40)
The formula that explains simple exponential smoothing is  t = (1 - α)
  t-1 + αxt for 0 < α < 1.
(True/False)
4.9/5 (33)
The more modern approach to time-series analysis concentrates on the isolation of the individual components (trend,seasonality,cyclical,and irregular)from a series.
(True/False)
4.9/5 (26)
THE NEXT QUESTIONS ARE BASED ON THE FOLLOWING INFORMATION:
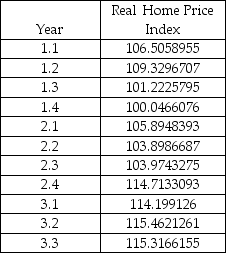
The table below is the quarterly data of the Shiller Real Home Price Index.To remove the seasonality a centered 4-point moving average is used.
 -What is the centered 4-point moving average for
  ?
?
(Multiple Choice)
4.8/5 (33)
The first-order autoregressive model expresses the current value,xt of a series in terms of the previous value,xt-1 and a nonautocorrelated random variable εt.
(True/False)
4.8/5 (37)
The table below shows the weekly sales of umbrellas during the rainy season.How will you go about removing the irregularity component of this time series using the method of 4-point moving averages?
(Essay)
4.8/5 (39)
THE NEXT QUESTIONS ARE BASED ON THE FOLLOWING INFORMATION:
The table below is the quarterly data of the Shiller Real Home Price Index.To remove the seasonality a centered 4-point moving average is used.
-Calculate the centered 4-point moving average for  .
.
(Multiple Choice)
4.9/5 (37)
THE NEXT QUESTIONS ARE BASED ON THE FOLLOWING INFORMATION:
The table below is the data set of the number of preorders received for a particular game on a weekly basis.
The forecaster uses the Holt-Winters Exponential Smoothing for nonseasonal series to forecast the number of preorders in future time periods.
He uses α = 0.8 and β = 0.5.(Hint: Use the formula from the text to arrive at the answers. )
-What is the approximate level estimate for week 8?
(Multiple Choice)
4.9/5 (43)
THE NEXT QUESTIONS ARE BASED ON THE FOLLOWING INFORMATION:
The table below shows the corporate earnings percentage of an enterprise for 5 years.
The company's forecaster uses the 4-period centered moving average to remove the seasonality component.
 -How will you go about removing the irregularity component of this time series using the method of 4-point moving averages?
(Essay)
4.7/5 (39)
THE NEXT QUESTIONS ARE BASED ON THE FOLLOWING INFORMATION:
The table below shows the corporate earnings percentage of an enterprise for 5 years.
The company's forecaster uses the 4-period centered moving average to remove the seasonality component.
-If the forecast value,  t,at time t is a weighted average of the previous period forecast
  t-1 and the latest observation
  t,write the formula used to compute the simple exponential smoothing forecast.
(Essay)
4.9/5 (31)
THE NEXT QUESTIONS ARE BASED ON THE FOLLOWING INFORMATION:
The table below is the quarterly data of the Shiller Real Home Price Index.To remove the seasonality a centered 4-point moving average is used.
-What is the value of  ?
?
(Multiple Choice)
4.9/5 (37)
THE NEXT QUESTIONS ARE BASED ON THE FOLLOWING INFORMATION:
The table below is the data set of the number of preorders received for a particular game on a weekly basis.
The forecaster uses the Holt-Winters Exponential Smoothing for nonseasonal series to forecast the number of preorders in future time periods.
He uses α = 0.8 and β = 0.5.(Hint: Use the formula from the text to arrive at the answers. )
-Which of the following weeks has an approximate trend estimate of 68?
(Multiple Choice)
4.8/5 (39)
THE NEXT QUESTIONS ARE BASED ON THE FOLLOWING INFORMATION:
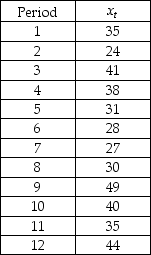
Consider the following quarterly time series data.
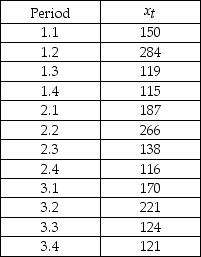 -Show the table with the forecast for each reading.
(Essay)
4.9/5 (30)
Filters
- Essay(0)
- Multiple Choice(0)
- Short Answer(0)
- True False(0)
- Matching(0)