Exam 16: Time-Series Analysis and Forecasting
Exam 1: Describing Data: Graphical247 Questions
Exam 2: Describing Data: Numerical326 Questions
Exam 3: Probability345 Questions
Exam 4: Discrete Random Variables and Probability Distributions257 Questions
Exam 5: Continuous Random Variables and Probability Distributions239 Questions
Exam 6: Sampling and Sampling Distributions147 Questions
Exam 7: Estimation: Single Population151 Questions
Exam 8: Estimation: Additional Topics109 Questions
Exam 9: Hypothesis Testing: Single Population164 Questions
Exam 10: Hypothesis Testing: Additional Topics103 Questions
Exam 11: Simple Regression217 Questions
Exam 12: Multiple Regression252 Questions
Exam 13: Additional Topics in Regression Analysis168 Questions
Exam 14: Analysis of Categorical Data241 Questions
Exam 15: Analysis of Variance192 Questions
Exam 16: Time-Series Analysis and Forecasting138 Questions
Exam 17: Additional Topics in Sampling110 Questions
Select questions type
THE NEXT QUESTIONS ARE BASED ON THE FOLLOWING INFORMATION:
The table below shows the corporate earnings percentage of an enterprise for 5 years.
The company's forecaster uses the 4-period centered moving average to remove the seasonality component.
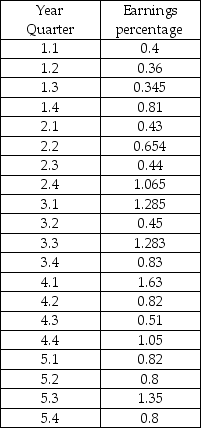 -What is the seasonal index for quarter 3?
(Multiple Choice)
4.8/5  (46)
(46)
THE NEXT QUESTIONS ARE BASED ON THE FOLLOWING INFORMATION:
The table below shows the corporate earnings percentage of an enterprise for 5 years.
The company's forecaster uses the 4-period centered moving average to remove the seasonality component.
-What is the seasonally adjusted value for x6?
(Multiple Choice)
4.8/5 (28)
THE NEXT QUESTIONS ARE BASED ON THE FOLLOWING INFORMATION:
The table below is the data set of the Shiller Real Home Price Index for the years 1934-1944.
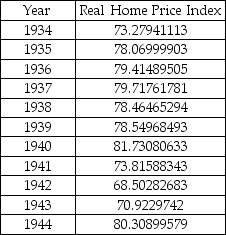 -Identify the four components of a time series.
(Essay)
4.8/5 (45)
THE NEXT QUESTIONS ARE BASED ON THE FOLLOWING INFORMATION:
The table below is the data set of the Shiller Real Home Price Index for the years 1894-1904.
Use a smoothing constant of α = 0.8 to determine the forecasts using simple exponential smoothing.
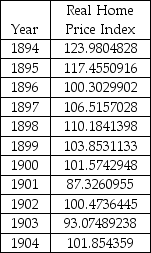 -Determine the error for the forecast that corresponds to the year 1899.
(Multiple Choice)
4.8/5 (27)
THE NEXT QUESTIONS ARE BASED ON THE FOLLOWING INFORMATION:
The table below is the data set of the number of preorders received for a particular game on a weekly basis.
The forecaster uses the Holt-Winters Exponential Smoothing for nonseasonal series to forecast the number of preorders in future time periods.
He uses α = 0.8 and β = 0.5.(Hint: Use the formula from the text to arrive at the answers. )
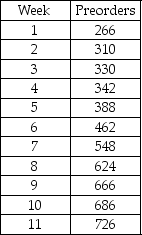 -Which of the following weeks has a level estimate of 672 units approximately?
(Multiple Choice)
4.9/5 (35)
THE NEXT QUESTIONS ARE BASED ON THE FOLLOWING INFORMATION:
The table below is the data set of the Shiller Real Home Price Index for the years 1894-1904.
Use a smoothing constant of α = 0.8 to determine the forecasts using simple exponential smoothing.
-The following are the values of a time series for the first four time periods: 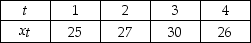 Using a four-period moving average,determine the forecasted value for time period 5.
(Multiple Choice)
4.9/5 (30)
THE NEXT QUESTIONS ARE BASED ON THE FOLLOWING INFORMATION:
The table below is the quarterly data of the Shiller Real Home Price Index.To remove the seasonality a centered 4-point moving average is used.
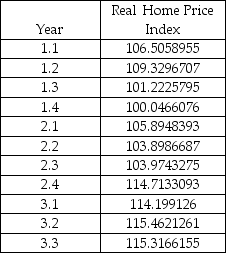 -Which of the following is the value of
  ?
?
(Multiple Choice)
5.0/5 (39)
Seasonal patterns in a time series constitute one form of regular,oscillatory behavior.
(True/False)
4.9/5 (38)
THE NEXT QUESTIONS ARE BASED ON THE FOLLOWING INFORMATION:
The table below is the data set of the Shiller Real Home Price Index for the years 1894-1904.
Use a smoothing constant of α = 0.8 to determine the forecasts using simple exponential smoothing.
-What is the forecast for the year 1896?
(Multiple Choice)
4.7/5 (38)
The irregular component of a time series exhibits a tendency to grow or decrease rather steadily over long periods of time.
(True/False)
5.0/5 (36)
The term seasonal variation may refer to the four traditional seasons,or to systematic patterns that occur during a month,a week,or even one day.
(True/False)
4.8/5 (42)
THE NEXT QUESTIONS ARE BASED ON THE FOLLOWING INFORMATION:
The daily sales figures shown below have been recorded in a medium size insurance
company.
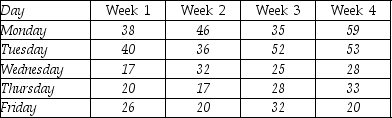 -Plot the series and the moving averages on the same graph.
(Essay)
4.9/5 (26)
THE NEXT QUESTIONS ARE BASED ON THE FOLLOWING INFORMATION:
The table below shows the corporate earnings percentage of an enterprise for 5 years.
The company's forecaster uses the 4-period centered moving average to remove the seasonality component.
 -How do you remove the seasonality component from the given time series.
(Essay)
4.9/5 (41)
If a time series is rather smooth,we would use a large value for the smoothing constant α in order to give more weight to the most recent observation.
(True/False)
4.8/5 (30)
The Holt-Winters Exponential Smoothing procedure allows for trend,but not seasonality,in a time series.
(True/False)
4.8/5 (31)
THE NEXT QUESTIONS ARE BASED ON THE FOLLOWING INFORMATION:
The daily sales figures shown below have been recorded in a medium size insurance
company.
-Does there appear to be a seasonal (weekly)pattern?
(Short Answer)
4.7/5 (31)
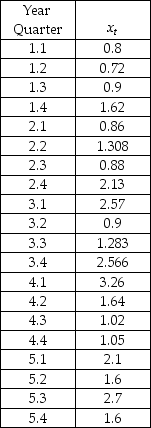
THE NEXT QUESTIONS ARE BASED ON THE FOLLOWING INFORMATION:
The table below shows the quarterly sales of a particular kind of vaccine for dogs.The forecaster uses autoregressive models with p = 3 to forecast the sales for future time periods.
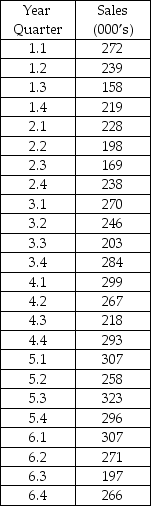 -Calculate the value of the sum of squared errors.
(Multiple Choice)
4.8/5 (33)
Filters
- Essay(0)
- Multiple Choice(0)
- Short Answer(0)
- True False(0)
- Matching(0)