Exam 16: Analyzing and Forecasting Time-Series Data
Exam 1: The Where,Why,and How of Data Collection167 Questions
Exam 2: Graphs,Charts and Tablesdescribing Your Data139 Questions
Exam 3: Describing Data Using Numerical Measures138 Questions
Exam 4: Introduction to Probability125 Questions
Exam 5: Discrete Probability Distributions161 Questions
Exam 6: Introduction to Continuous Probability Distributions122 Questions
Exam 7: Introduction to Sampling Distributions136 Questions
Exam 8: Estimating Single Population Parameters174 Questions
Exam 9: Introduction to Hypothesis Testing183 Questions
Exam 10: Estimation and Hypothesis Testing for Two Population Parameters121 Questions
Exam 11: Hypothesis Tests and Estimation for Population Variances69 Questions
Exam 12: Analysis of Variance162 Questions
Exam 13: Goodness-Of-Fit Tests and Contingency Analysis105 Questions
Exam 14: Introduction to Linear Regression and Correlation Analysis139 Questions
Exam 15: Multiple Regression Analysis and Model Building152 Questions
Exam 16: Analyzing and Forecasting Time-Series Data133 Questions
Exam 17: Introduction to Nonparametric Statistics103 Questions
Exam 18: Introduction to Quality and Statistical Process Control43 Questions
Select questions type
In a double smoothing model,large values for the two smoothing constants will result in greater smoothing of the time series.
(True/False)
4.7/5  (34)
(34)
The Gilbert Company chief financial officer has been tracking annual sales for each of the company's three divisions for the past 10 years.At a recent meeting,he pointed to the annual data and indicated that it clearly showed the seasonality associated with its business.Given the data,this statement may have been very appropriate.
(True/False)
4.8/5 (23)
Double exponential smoothing is used instead of single exponential smoothing when extra smooth forecasts are desired.
(True/False)
4.8/5 (35)
The Durbin-Watson test for autocorrelation can be reliably applied to any sample sizes.
(True/False)
4.8/5 (36)
In comparing two or more forecasting models,the MAD value is useful in determining how successful the models were in fitting historical data.
(True/False)
4.9/5 (33)
If a time series involves monthly data there will be a total of 12 seasonal indexes.
(True/False)
4.8/5 (29)
If the Durbin-Watson test leads you to reject the null hypothesis,then you are concluding that the forecast errors are positively autocorrelated.
(True/False)
4.9/5 (34)
Forecast bias measures the average amount of error per forecast,so a positive value means that forecasts tended to be too low.
(True/False)
4.9/5 (38)
In a recent meeting,a manager indicated that sales tend to be higher during October,November,and December and lower in the spring.In making this statement,she is indicating that sales for the company are cyclical.
(True/False)
4.9/5 (27)
The Norton Industrial Company has 12 quarters of historical sales data and is interested in forecasting sales for quarter 13.The following data are available:
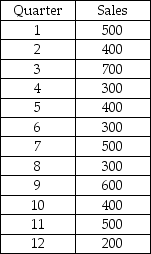 Based on this data,using simple exponential smoothing with a smoothing constant value equal to 0.10 and a starting forecast value equal to the sales in quarter 1 to forecast sales for period 13,what is the MAD value for periods 2-12?
(Essay)
4.9/5 (41)
Two common unweighted indexes are the Paasche Index and the Laspeyres Index.
(True/False)
4.9/5 (37)
Model specification is the process of determining how well a forecasting model fits the past data.
(True/False)
4.9/5 (39)
If a time series contains substantial irregular movement,the smoothing constant for a single exponential smoothing model that is close to 1.0 will result in forecasts that are not as smoothed out as those that would occur if a smaller smoothing constant was used.
(True/False)
4.8/5 (39)
The reason for testing for the presence of autocorrelation in a regression-based trend forecasting model is that one assumption of the regression analysis is that the residuals are not correlated.
(True/False)
5.0/5 (29)
Renton Industries makes replacement parts for the automobile industry.As part of the company's capacity planning,it needs a long-range total demand forecast.The following information was generated based on 10 years of historical data on total number of parts sold each year. 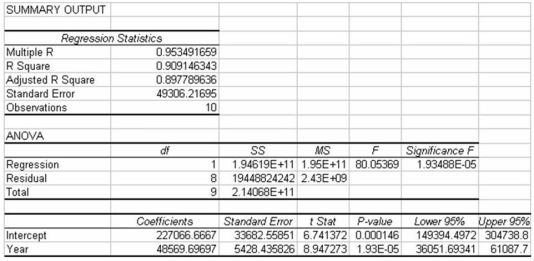 Based on this information we can conclude that the linear trend model explains a significant proportion of the variation in the number of parts sold,because the p-value is much smaller than any reasonable α that we might use.
(True/False)
5.0/5 (39)
It is possible to conduct a statistical test for autocorrelation using the Durbin-Watson test and not be able to make a definitive conclusion about whether there is autocorrelation or not based on the data.
(True/False)
4.8/5 (34)
Gibson,Inc.is a holding company that owns several businesses.One such business is a truck sales company.To help in managing this operation,managers at Gibson have collected sales data for the past 20 years showing the number of trucks sold each year.They have then developed the linear trend forecasting model shown as follows: 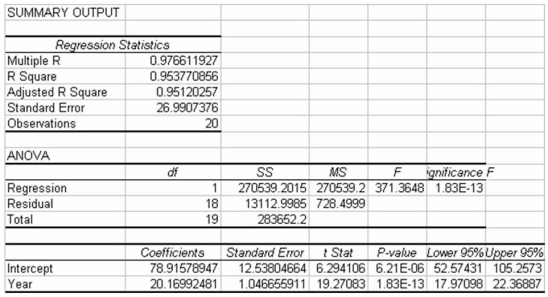 Based on this information,the fitted value for year 1 is about 99.
(True/False)
4.8/5 (36)
In measuring forecast errors,the MAD and the square root of the MSE will provide similar (but not identical)values,in that both provide a measure of the "typical" amount of error in forecasts.
(True/False)
4.9/5 (36)
The Boxer Company has been in business since 1998.The following sales data are recorded by quarter for the years 2010-2012. 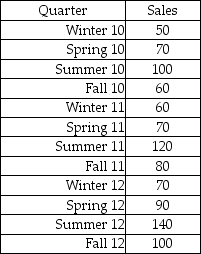 The managers at the company wish to determine the seasonal indexes for each quarter during the year.The index for the summer quarter is:
(Multiple Choice)
4.9/5 (31)
The Morgan Company is interested in developing a forecast for next month's sales.It has collected sales data for the past 12 months.
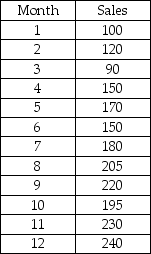 After analyzing these data,if the company wishes to use double exponential smoothing with alpha = 0.20 and beta = 0.20,the starting values for the constant process and the trend process can be derived from a linear trend regression model by using the intercept and slope coefficient respectively.
(True/False)
4.8/5 (38)
Filters
- Essay(0)
- Multiple Choice(0)
- Short Answer(0)
- True False(0)
- Matching(0)