Exam 16: Analyzing and Forecasting Time-Series Data
Exam 1: The Where,Why,and How of Data Collection167 Questions
Exam 2: Graphs,Charts and Tablesdescribing Your Data139 Questions
Exam 3: Describing Data Using Numerical Measures138 Questions
Exam 4: Introduction to Probability125 Questions
Exam 5: Discrete Probability Distributions161 Questions
Exam 6: Introduction to Continuous Probability Distributions122 Questions
Exam 7: Introduction to Sampling Distributions136 Questions
Exam 8: Estimating Single Population Parameters174 Questions
Exam 9: Introduction to Hypothesis Testing183 Questions
Exam 10: Estimation and Hypothesis Testing for Two Population Parameters121 Questions
Exam 11: Hypothesis Tests and Estimation for Population Variances69 Questions
Exam 12: Analysis of Variance162 Questions
Exam 13: Goodness-Of-Fit Tests and Contingency Analysis105 Questions
Exam 14: Introduction to Linear Regression and Correlation Analysis139 Questions
Exam 15: Multiple Regression Analysis and Model Building152 Questions
Exam 16: Analyzing and Forecasting Time-Series Data133 Questions
Exam 17: Introduction to Nonparametric Statistics103 Questions
Exam 18: Introduction to Quality and Statistical Process Control43 Questions
Select questions type
After a linear forecasting model is found for a time series,if the Durbin-Watson statistic is less than dL this means that:
(Multiple Choice)
4.9/5  (36)
(36)
A time-series plot that exhibits a general increase in value from the early periods to the latest time periods:
(Multiple Choice)
4.7/5 (39)
To deseasonalize a time series,assuming a multiplicative model,the observed values are divided by the appropriate seasonal index.
(True/False)
4.8/5 (28)
The Baker's Candy Company has been in business for three years.The quarterly sales data for the company are shown as follows:
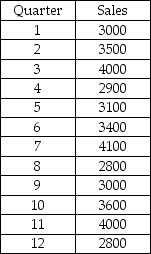 As a first step in computing a seasonal index,the four-period moving average corresponding to the mid-point between periods 2 and 3 is 3,350.
(True/False)
4.7/5 (37)
To compare one value measured at one point in time with other values measured at different points in time,index numbers must be used.
(True/False)
4.9/5 (42)
If you suspect that your time-series data has a strong downward trend,you should set the beta smoothing constant at value fairly close to negative 1.0
(True/False)
4.9/5 (24)
Recently,a manager for a major retailer computed the following seasonal indexes:
 Note that the index for Summer Qtr is missing.However,it can be determined that the index for that period is approximately 1.03
(True/False)
4.8/5 (28)
Which of the following is true regarding the MSE and MAD in forecasting?
(Multiple Choice)
4.9/5 (41)
If time-series data exhibit a seasonal pattern,which of the following approaches could be used to compute season indexes?
(Multiple Choice)
4.7/5 (35)
The process of selecting the forecasting technique to use in a particular application is called:
(Multiple Choice)
4.7/5 (29)
One of the basic tools for creating a trend-based forecasting model is regression analysis.
(True/False)
4.9/5 (31)
A company has recorded annual sales for the past 14 years and found the following linear trend model:  = 5.23 + 144.60t.This means that:
(Multiple Choice)
4.7/5 (24)
Given the following time series data: 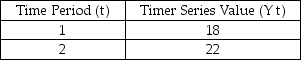 and using smoothing constants of alpha = 0.3,the exponential smoothing forecast for time period 3 is
(Multiple Choice)
4.8/5 (37)
If a time-series plot indicates that the data do not appear to exhibit a trend,then a double exponential smoothing model would likely be the most appropriate to use rather than simple exponential smoothing model.
(True/False)
4.8/5 (31)
If the Durbin-Watson d statistic has a value close to 2,there is reason to believe that there is no autocorrelation between the forecast errors.
(True/False)
4.8/5 (34)
The Boxer Company has been in business since 1998.The following sales data are recorded by quarter for the years 2010-2012. 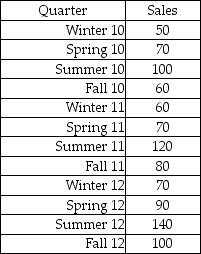 Which of the following time-series components are present in these data?
(Multiple Choice)
4.9/5 (33)
The Morgan Company is interested in developing a forecast for next month's sales.It has collected sales data for the past 12 months.
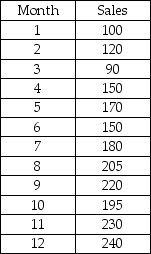 After analyzing these data,if the company wishes to use exponential smoothing,it should employ a single smoothing model since there is evidence of a linear trend in the data.
(True/False)
4.8/5 (29)
The Wilson Company is interested in forecasting demand for its XG-667 product for quarter 13 based on 12 quarters of data.The following shows the data and the double exponential smoothing model results for periods 1-12 using alpha = 0.20 and beta = 0.40. 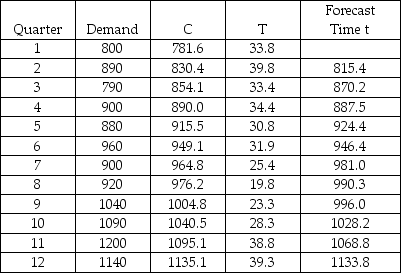 Based on this information,which of the following is the forecast for period 13?
(Multiple Choice)
4.9/5 (31)
In a time series with quarterly sales data,assume that the seasonal index for the summer quarter has been found to be 0.87,this can be interpreted to mean that sales tend to be 87 percent higher in the summer quarter when compared to the other quarters.
(True/False)
4.9/5 (32)
An advantage of exponential smoothing techniques over a regression-based trend model is that the exponential smoothing model allows us to weigh each observation equally,thereby giving a fairer method of developing a forecast.
(True/False)
4.7/5 (29)
Filters
- Essay(0)
- Multiple Choice(0)
- Short Answer(0)
- True False(0)
- Matching(0)