Exam 16: Analyzing and Forecasting Time-Series Data
Exam 1: The Where,Why,and How of Data Collection167 Questions
Exam 2: Graphs,Charts and Tablesdescribing Your Data139 Questions
Exam 3: Describing Data Using Numerical Measures138 Questions
Exam 4: Introduction to Probability125 Questions
Exam 5: Discrete Probability Distributions161 Questions
Exam 6: Introduction to Continuous Probability Distributions122 Questions
Exam 7: Introduction to Sampling Distributions136 Questions
Exam 8: Estimating Single Population Parameters174 Questions
Exam 9: Introduction to Hypothesis Testing183 Questions
Exam 10: Estimation and Hypothesis Testing for Two Population Parameters121 Questions
Exam 11: Hypothesis Tests and Estimation for Population Variances69 Questions
Exam 12: Analysis of Variance162 Questions
Exam 13: Goodness-Of-Fit Tests and Contingency Analysis105 Questions
Exam 14: Introduction to Linear Regression and Correlation Analysis139 Questions
Exam 15: Multiple Regression Analysis and Model Building152 Questions
Exam 16: Analyzing and Forecasting Time-Series Data133 Questions
Exam 17: Introduction to Nonparametric Statistics103 Questions
Exam 18: Introduction to Quality and Statistical Process Control43 Questions
Select questions type
The Norton Industrial Company has 12 quarters of historical sales data and is interested in forecasting sales for quarter 13.The following data are available:
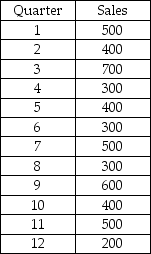 Based on this data,use simple exponential smoothing with a smoothing constant value equal to 0.10 and a starting forecast value equal to the sales in quarter 1 to forecast sales for period 13.
(Essay)
4.8/5  (35)
(35)
Herb Criner,an analyst for the Folgerty Company,recently gave a report in which he stated that the annual sales forecast based on 20 years of annual sales data was done using a seasonally adjusted,trend-based forecasting technique.Given the information presented here,this statement has the potential to be credible.
(True/False)
4.8/5 (41)
If a smoothing model is applied with a smoothing constant exceeding 0.50,the forecasting bias will tend to be positive in most cases.
(True/False)
5.0/5 (35)
In a recent meeting,the sales manager for a drug company stated that she needed to have a forecast prepared for each week for the next six weeks.The week in this case is the:
(Multiple Choice)
4.7/5 (38)
A company has developed a linear trend regression model based on 16 quarters of data.The independent variable is the measure of time (t = 1 thru 16 where quarter 1 is winter quarter,2 is spring,etc. ).The company has also developed seasonal indexes for each quarter as follows:  The linear trend forecast equation is:
  = 120 + 56t.
Given this information,which of the four quarters beginning next winter (period t = 17)will have the highest seasonally adjusted forecast?
= 120 + 56t.
Given this information,which of the four quarters beginning next winter (period t = 17)will have the highest seasonally adjusted forecast?
(Multiple Choice)
4.9/5 (29)
A seasonally unadjusted forecast is one that is made from seasonal data without any adjustment for the seasonal component in the time series.
(True/False)
4.9/5 (38)
The Baker's Candy Company has been in business for three years.The quarterly sales data for the company are shown as follows:
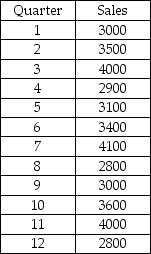 Based on these data,the seasonal index for quarters 3,7,and 11 is approximately 1.61
(True/False)
4.8/5 (32)
Which of the following is true about deseasonalizing data?
(Multiple Choice)
4.8/5 (31)
The Cresswell Company updates its annual sales forecast every month as new sales data becomes available.The one-month update is called:
(Multiple Choice)
4.9/5 (29)
The owners of Hal's Cookie Company have collected sales data for the past 8 months.These data are shown as follows:
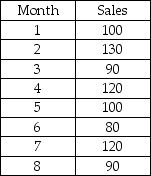 Using a smoothing constant of 0.4,the forecast value for period 3 is 112.
(True/False)
4.8/5 (34)
Because simple exponential smoothing models require a starting point for the first period forecast that will be arbitrary,it is important to have as much data as possible to dampen out the effect of the starting point.
(True/False)
4.8/5 (36)
The Wilson Company is interested in forecasting demand for its XG-667 product for quarter 13 based on 12 quarters of data.The following shows the data and the double exponential smoothing model results for periods 1-12 using alpha = 0.20 and beta = 0.40.  Based on this information,what is the MAD value for quarters 2-12?
(Multiple Choice)
4.9/5 (32)
Renton Industries makes replacement parts for the automobile industry.As part of the company's capacity planning,it needs a long-range total demand forecast.The following information was generated based on 10 years of historical data on total number of parts sold each year.  Based on this information,we can conclude that sales on average have been growing by more than 48 thousand annually.
(True/False)
4.7/5 (37)
The Wilson Company is interested in forecasting demand for its XG-667 product for quarter 13 based on 12 quarters of data.The following shows the data and the double exponential smoothing model results for periods 1-12 using alpha = 0.20 and beta = 0.40 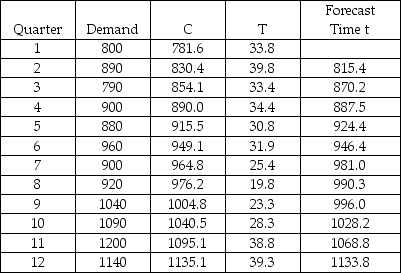 Based on this information,what is the difference between the forecast for period 13 using smoothing constants of alpha = 0.20 and beta = 0.40 and smoothing constants of alpha = 0.10 and beta = 0.30? (Assume that the starting values for period 0 are C = 745 and T = 32. )
(Multiple Choice)
4.9/5 (33)
Some stocks are referred to as cyclical stock because they tend to be in favor for several years and then out of favor for several years.This is a correct use of the term cyclical.
(True/False)
4.7/5 (33)
Which of the following forecasting methods allows the decision maker to weigh the past time series differently to make the model more sensitive to more recent data?
(Multiple Choice)
5.0/5 (30)
If the observed value in a time series for period 3 is yt = 128,and the seasonal index that applies to period 3 is 1.20,then the deseasonalized value for period 3 is 153.6
(True/False)
4.9/5 (31)
Renton Industries makes replacement parts for the automobile industry.As part of the company's capacity planning,it needs a long-range total demand forecast.The following information was generated based on 10 years of historical data on total number of parts sold each year. 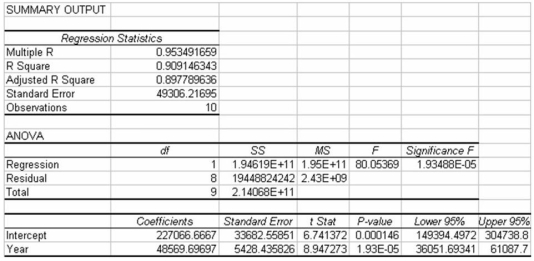 Based on this information,the percent of variation in the number of parts sold that is explained by the linear trend model is approximately 90.9.
(True/False)
4.8/5 (36)
In a double smoothing model,the second smoothing constant is introduced to account for the trend in the data if one exists.
(True/False)
4.8/5 (38)
In a single exponential smoothing model,a large value for the smoothing constant will result in greater smoothing of the data than will a smoothing constant close to zero.
(True/False)
4.9/5 (37)
Filters
- Essay(0)
- Multiple Choice(0)
- Short Answer(0)
- True False(0)
- Matching(0)