Exam 16: Analyzing and Forecasting Time-Series Data
Exam 1: The Where,Why,and How of Data Collection167 Questions
Exam 2: Graphs,Charts and Tablesdescribing Your Data139 Questions
Exam 3: Describing Data Using Numerical Measures138 Questions
Exam 4: Introduction to Probability125 Questions
Exam 5: Discrete Probability Distributions161 Questions
Exam 6: Introduction to Continuous Probability Distributions122 Questions
Exam 7: Introduction to Sampling Distributions136 Questions
Exam 8: Estimating Single Population Parameters174 Questions
Exam 9: Introduction to Hypothesis Testing183 Questions
Exam 10: Estimation and Hypothesis Testing for Two Population Parameters121 Questions
Exam 11: Hypothesis Tests and Estimation for Population Variances69 Questions
Exam 12: Analysis of Variance162 Questions
Exam 13: Goodness-Of-Fit Tests and Contingency Analysis105 Questions
Exam 14: Introduction to Linear Regression and Correlation Analysis139 Questions
Exam 15: Multiple Regression Analysis and Model Building152 Questions
Exam 16: Analyzing and Forecasting Time-Series Data133 Questions
Exam 17: Introduction to Nonparametric Statistics103 Questions
Exam 18: Introduction to Quality and Statistical Process Control43 Questions
Select questions type
A company has developed a linear trend model to forecast monthly sales.The following data show the actual sales and the "fitted" sales for months 1-12. 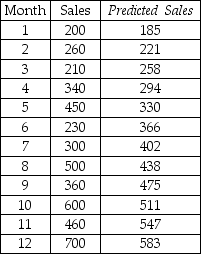 Based on these data,what is the value for the mean absolute deviation for months 1-12?
(Multiple Choice)
4.7/5  (37)
(37)
A company has developed a linear trend model to forecast monthly sales.The following data show the actual sales and the "fitted" sales for months 1-12.  Based on these data,what is the mean square error for the linear trend model?
(Multiple Choice)
4.7/5 (31)
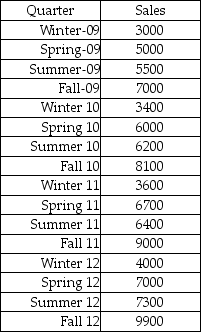
The Boxer Company has been in business since 1998.The following sales data are recorded by quarter for the years 2010-2012. 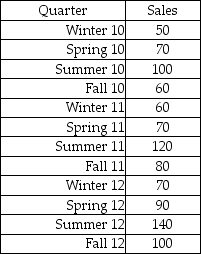 The managers at the company wish to determine the seasonal indexes for each quarter during the year.The first step in the process is to remove the seasonal and random components.To do this,they will begin by computing a four-period moving average.They then compute the centered moving average.What is the next step in applying the multiplicative model?
(Multiple Choice)
4.8/5 (38)
A stockbroker at a large brokerage firm recently analyzed the combined annual profits for all firms in the airline industry.One time-series component that may have been present in these annual data was a seasonal component.
(True/False)
4.9/5 (31)
You are given the following linear trend model: Ft = 345.60 - 200.5(t).This model implies that in year 1,the dependent variable had a value of 145.1.
(True/False)
4.8/5 (35)
Large values of the Durbin-Watson d statistic indicate that positive autocorrelation among the forecast errors exists.
(True/False)
4.9/5 (26)
The time-series component that implies a long-term upward or downward pattern is called the trend component.
(True/False)
4.8/5 (38)
While virtually all time series exhibit a random component,not all time series exhibit other components.
(True/False)
5.0/5 (19)
Recently,a manager for a major retailer computed the following seasonal indexes:
 The manager then developed the following least squares trend model based on the past five years of quarterly data:
  = 200 + 11.5t.Based on this,the seasonally adjusted forecast for quarter 25,which is the winter quarter,is 489.11
(True/False)
5.0/5 (30)
Which of the following time-series components is almost always present in sales data for electronics companies?
(Multiple Choice)
4.8/5 (33)
The reason for using split samples in developing a forecasting model is to eliminate the potential for bias in the resulting model.
(True/False)
4.7/5 (28)
A company has developed a linear trend regression model based on 16 quarters of data.The independent variable is the measure of time (t = 1 thru 16 where quarter 1 is winter quarter,2 is spring,etc. ).The company has also developed seasonal indexes for each quarter as follows:  The linear trend forecast equation is:
  = 120 + 56t.
Given this information,what is the seasonally adjusted forecast for period 19?
= 120 + 56t.
Given this information,what is the seasonally adjusted forecast for period 19?
(Multiple Choice)
4.9/5 (33)
In a single exponential smoothing model,finding the forecast value for each period requires having the actual and forecast values from the proceeding period.This is not possible for the first period,so for the first period one should use the actual value as the forecast value.
(True/False)
4.8/5 (35)
If a forecasting model produces forecast errors (residuals)that are negatively correlated,then we expect a negative residual to be followed by another negative residual to be followed by another negative residual and so forth.
(True/False)
4.9/5 (30)
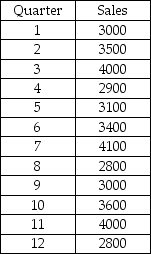
The All American Toy Company has a very seasonal sales pattern.Sales are high during the fall quarter,drop off substantially in the winter quarter and are more typical during spring and summer quarters.The following historical data exist for the past 16 quarters.
 Based on these data,develop a seasonally adjusted forecast for the four quarters of 2013 using a linear trend regression model.
(Essay)
4.9/5 (40)
The Baker's Candy Company has been in business for three years.The quarterly sales data for the company are shown as follows:
 Based on this information,the data reflect both a linear trend and seasonal components.
(True/False)
4.8/5 (29)
The following output is provided for a linear trend regression-based forecasting model based on 12 months of data: 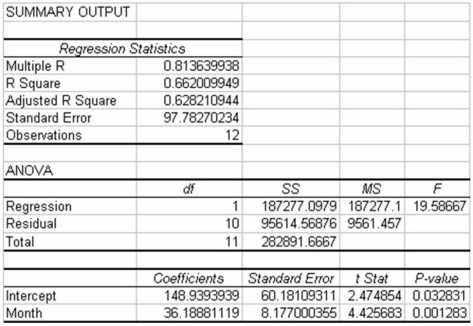 Suppose that the actual sales for months 13-15 are: 720,680,800.Given this,which of the following is the forecast bias value for months 13-15?
(Multiple Choice)
4.9/5 (34)
The forecasting interval is the unit of time for which forecasts are made.
(True/False)
4.8/5 (37)
You are given the following linear trend model: Ft = 345.60 - 200.5(t).The forecast for period 15 is approximately -2,662.
(True/False)
4.9/5 (34)
Filters
- Essay(0)
- Multiple Choice(0)
- Short Answer(0)
- True False(0)
- Matching(0)