Exam 16: Analyzing and Forecasting Time-Series Data
Exam 1: The Where,Why,and How of Data Collection167 Questions
Exam 2: Graphs,Charts and Tablesdescribing Your Data139 Questions
Exam 3: Describing Data Using Numerical Measures138 Questions
Exam 4: Introduction to Probability125 Questions
Exam 5: Discrete Probability Distributions161 Questions
Exam 6: Introduction to Continuous Probability Distributions122 Questions
Exam 7: Introduction to Sampling Distributions136 Questions
Exam 8: Estimating Single Population Parameters174 Questions
Exam 9: Introduction to Hypothesis Testing183 Questions
Exam 10: Estimation and Hypothesis Testing for Two Population Parameters121 Questions
Exam 11: Hypothesis Tests and Estimation for Population Variances69 Questions
Exam 12: Analysis of Variance162 Questions
Exam 13: Goodness-Of-Fit Tests and Contingency Analysis105 Questions
Exam 14: Introduction to Linear Regression and Correlation Analysis139 Questions
Exam 15: Multiple Regression Analysis and Model Building152 Questions
Exam 16: Analyzing and Forecasting Time-Series Data133 Questions
Exam 17: Introduction to Nonparametric Statistics103 Questions
Exam 18: Introduction to Quality and Statistical Process Control43 Questions
Select questions type
If you suspect that a nonlinear trend exists in your data,one way to deal with it in a trend-based forecasting application is to transform the independent variable,for example by squaring the time measure or maybe taking the square-root of the time measure.
(True/False)
4.7/5  (34)
(34)
The owners of Hal's Cookie Company have collected sales data for the past 8 months.These data are shown as follows:
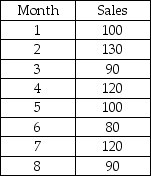 Using a smoothing constant equal to 0.20 and starting forecast in period 1 of 100,the forecast value for period 9 is approximately 104.2.
(True/False)
4.8/5 (35)
If a company has 12 years of annual sales data and is in need of a three-year forecast,which of the following forecasting techniques might be useful?
(Multiple Choice)
4.9/5 (39)
The Boxer Company has been in business since 1998.The following sales data are recorded by quarter for the years 2010-2012. 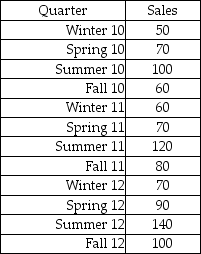 The managers at the company wish to determine the seasonal indexes for each quarter during the year.The first step in the process is to remove the seasonal and random components.To do this,they will begin by computing a four period moving average.What is the four-period moving average based on Winter 99 - Fall 99?
(Multiple Choice)
4.8/5 (37)
If the historical data on which the model is being built consist of weekly data,the forecasting period would also be weekly.
(True/False)
4.8/5 (29)
Which of the following is true about index numbers? Index numbers are:
(Multiple Choice)
4.8/5 (37)
The most useful tool to identify the trend component of a time series is
(Multiple Choice)
4.7/5 (33)
The All American Toy Company has records for quarterly sales for the past 4 years.These data are shown as follows:
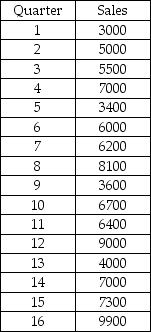 Given these data,develop a forecast for quarter 17 using a double exponential smoothing model with alpha = 0.20,beta = 0.30 and starting values for C and T based on the linear trend regression model for periods 1-16.
(Essay)
4.8/5 (36)
The purpose of deseasonalizing a time series is that a strong seasonal pattern may make it difficult to see a trend in the time series.
(True/False)
4.7/5 (44)
Assume that the year 2000 is used as the index base period and that sales were 12 million in the year 2000.If sales were 18 million in the year 2006,the simple index number for the year 2006 is:
(Multiple Choice)
4.8/5 (39)
In establishing a single exponential smoothing forecasting model,a starting point for the forecast value for period 1 is required.One method for arriving at this starting point is to use the first data point as the forecast for that period.If we do that,then the first data point should be ignored when computing measures of forecast error.
(True/False)
4.8/5 (35)
A company's annual sales are shown below in thousands of dollars for a period of 10 years.
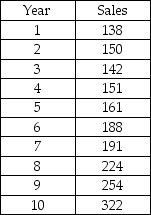 Plot the time series;find the linear regression model,and also the forecast value and error for each of the years.Also discuss whether you think a linear model appears to be appropriate.
(Essay)
5.0/5 (35)
One of the disadvantages of a regression-based linear trend forecasting model is that the forecast errors are computed for time periods that were used in developing the forecasting model and thus do not truly measure the forecasting ability of the model.
(True/False)
4.8/5 (36)
Filters
- Essay(0)
- Multiple Choice(0)
- Short Answer(0)
- True False(0)
- Matching(0)