Exam 2: Graphical Descriptive Techniques 1
Exam 1: What Is Statistics46 Questions
Exam 2: Graphical Descriptive Techniques 194 Questions
Exam 3: Graphical Descriptive Techniques 2156 Questions
Exam 4: Numerical Descriptive Techniques275 Questions
Exam 5: Data Collection and Sampling84 Questions
Exam 6: Probability240 Questions
Exam 7: Random Variables and Discrete Probability Distributions283 Questions
Exam 8: Continuous Probability Distributions224 Questions
Exam 9: Sampling Distributions156 Questions
Exam 10: Introduction to Estimation154 Questions
Exam 11: Introduction to Hypothesis Testing189 Questions
Exam 12: Inference About a Population153 Questions
Exam 13: Inference About Comparing Two Populations170 Questions
Exam 14: Analysis of Variance157 Questions
Exam 15: Chi-Squared Tests179 Questions
Exam 16: Simple Linear Regression and Correlation304 Questions
Exam 17: Multiple Regression160 Questions
Exam 18: Model Building148 Questions
Exam 19: Nonparametric Statistics175 Questions
Exam 20: Time-Series Analytics and Forecasting225 Questions
Exam 21: Statistical Process Control140 Questions
Exam 22: Decision Analysis123 Questions
Exam 23: Conclusion47 Questions
Select questions type
With nominal data,there is one and only one way the possible values can be ordered.
(True/False)
4.8/5  (27)
(27)
A frequency distribution lists the categories and the proportion with which each occurs.
(True/False)
4.7/5 (29)
Give an example of interval data that can also be treated as ordinal data and nominal data.
(Essay)
4.8/5 (39)
Car Buyers Forty car buyers were asked to indicate which car dealer offered the best overall service.The four choices were Contour Motors (C),Modern Chrysler (M),Tonneau Auto (T),and Uncanny Chevrolet (U).The following data were obtained: 
-{Car Buyers Narrative} Construct a pie chart of this data.Which car dealer offered the best overall service?
-{Car Buyers Narrative} Construct a pie chart of this data.Which car dealer offered the best overall service?
(Essay)
4.8/5 (32)
Bar and pie charts are graphical techniques for nominal data.The former focus the attention on the frequency of the occurrences of each category,and the later emphasizes the proportion of occurrences of each category.
(True/False)
4.8/5 (32)
We can summarize nominal data in a table that presents the categories and their counts.This table is called a(n)____________________ distribution.
(Short Answer)
4.9/5 (31)
A pie chart shows the ____________________ of individuals that fall into each category.
(Short Answer)
4.7/5 (38)
Using Excel,draw two pie charts that compare type of customer for males vs.females.Are gender and promotional customers related? 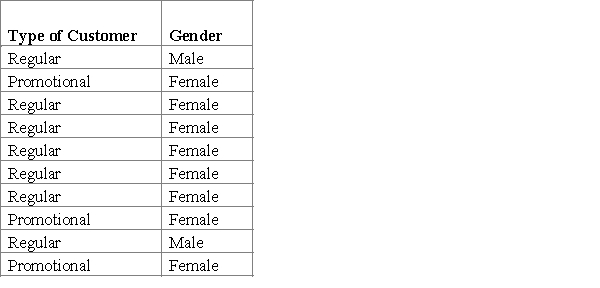
(Essay)
4.9/5 (31)
You cannot calculate and interpret differences between numbers assigned to ordinal data.
(True/False)
4.8/5 (37)
Which of the following techniques can be used to explore relationships between two nominal variables?
(Multiple Choice)
4.8/5 (41)
If the relative frequencies in the rows of a cross-classification table are similar,then the two variables shown in the table are not related.
(True/False)
4.8/5 (39)
At the end of a safari,the tour guide asks the vacationers to respond to the questions listed below.For each question,determine whether the possible responses are interval,nominal,or ordinal.
a.How many safaris have you taken prior to this one?
b.Do you feel that your tour safari lasted sufficiently long (yes/no)?
c.Which of the following features of the accommodations did you find most attractive: location,facilities,room size,service,or price?
d.What is the maximum number of hours per day that you would like to spend traveling?
e.Is your overall rating of this safari: excellent,good,fair,or poor?
(Essay)
4.9/5 (34)
Which of the following statements about pie charts is false?
(Multiple Choice)
4.8/5 (38)
Whether or not you are over the age of 21 is a nominal variable.
(True/False)
4.9/5 (29)
{All-Nighters Narrative} Briefly explain (using percentages)whether staying up all night before this midterm is related to a student doing poorly.
(Essay)
4.9/5 (34)
In the following cross-classification table,gender and fantasy baseball participation are related. 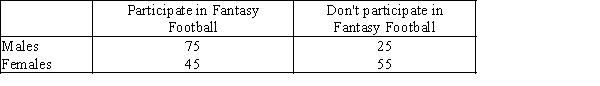
(True/False)
4.9/5 (29)
Filters
- Essay(0)
- Multiple Choice(0)
- Short Answer(0)
- True False(0)
- Matching(0)