Exam 2: Graphical Descriptive Techniques 1
Exam 1: What Is Statistics46 Questions
Exam 2: Graphical Descriptive Techniques 194 Questions
Exam 3: Graphical Descriptive Techniques 2156 Questions
Exam 4: Numerical Descriptive Techniques275 Questions
Exam 5: Data Collection and Sampling84 Questions
Exam 6: Probability240 Questions
Exam 7: Random Variables and Discrete Probability Distributions283 Questions
Exam 8: Continuous Probability Distributions224 Questions
Exam 9: Sampling Distributions156 Questions
Exam 10: Introduction to Estimation154 Questions
Exam 11: Introduction to Hypothesis Testing189 Questions
Exam 12: Inference About a Population153 Questions
Exam 13: Inference About Comparing Two Populations170 Questions
Exam 14: Analysis of Variance157 Questions
Exam 15: Chi-Squared Tests179 Questions
Exam 16: Simple Linear Regression and Correlation304 Questions
Exam 17: Multiple Regression160 Questions
Exam 18: Model Building148 Questions
Exam 19: Nonparametric Statistics175 Questions
Exam 20: Time-Series Analytics and Forecasting225 Questions
Exam 21: Statistical Process Control140 Questions
Exam 22: Decision Analysis123 Questions
Exam 23: Conclusion47 Questions
Select questions type
The Chief of Police conducted a survey of the officers on his squad.An officer's shooting score at target practice is an example of a(n)____________________ variable.
(Short Answer)
4.7/5  (45)
(45)
The bar charts below summarize data collected on 100 adults regarding gender and pet ownership.Which of the following statements is (are)true based on this chart? 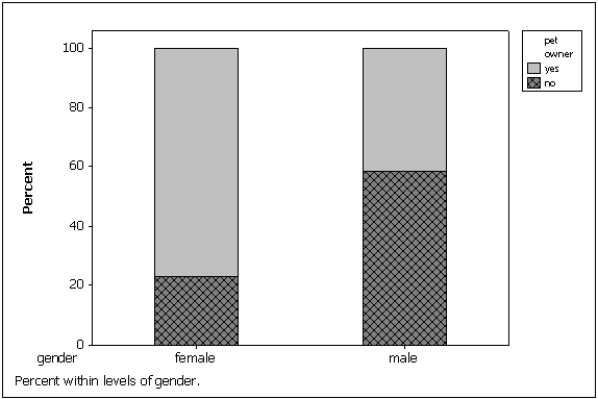
(Multiple Choice)
4.9/5 (26)
A(n)____________________ chart is not able to show frequencies.It can only show relative frequencies.
(Short Answer)
4.9/5 (29)
A college professor classifies his students according to their grade point average (GPA)and their gender.The resulting cross-classification table is shown below. 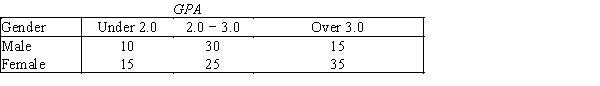 If you made a pie chart for male GPAs and a pie chart for female GPAs,those pie charts would look the same.
(True/False)
4.8/5 (21)
If two nominal variables are unrelated,then the patterns exhibited in their corresponding pie charts should be approximately the same.If some relationship exists,then some pie charts will differ from others.
(True/False)
4.9/5 (32)
Before leaving a particular restaurant,customers are asked to respond to the questions listed below.For each question,determine whether the possible responses are interval,nominal,or ordinal.
a.What is the approximate distance (in miles)between this restaurant and your residence?
b.Have you ever eaten at this restaurant before?
c.On how many occasions have you eaten at the restaurant before?
d.Which of the following attributes of this restaurant do you find most attractive: service,prices,quality of the food,or the menu?
e.What is your overall rating of the restaurant: excellent,good,fair,or poor?
(Essay)
4.8/5 (32)
A(n)____________________ chart is often used to display frequencies; a(n)____________________ chart graphically shows relative frequencies.
(Short Answer)
4.7/5 (31)
A statistics professor classifies his students according to their grade point average (GPA)and their gender.The resulting cross-classification table is shown below. 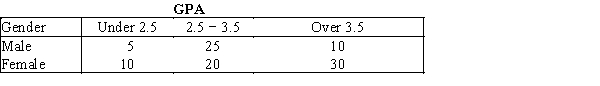 Which of the following describes the relationship between GPA and gender shown by this table?
(Multiple Choice)
4.8/5 (35)
In purchasing an automobile,there are a number of variables to consider.The body style of the car (sedan,coupe,wagon,etc.)is an example of a(n)____________________ variable.
(Short Answer)
4.7/5 (43)
A researcher wishes to estimate the textbook costs of first-year students at Barry University.To do so,he recorded the textbook cost of 300 first-year students and found that their average textbook cost was $195 per semester.The variable of interest to the researcher is
(Multiple Choice)
4.8/5 (30)
Values must represent ordered rankings for what type of data?
(Multiple Choice)
4.9/5 (37)
The Dean of Students conducted a survey on campus.Class rank (Freshman,Sophomore,Junior,and Senior)is an example of a(n)____________________ variable.
(Short Answer)
4.9/5 (33)
Filters
- Essay(0)
- Multiple Choice(0)
- Short Answer(0)
- True False(0)
- Matching(0)