Exam 2: Graphical Descriptive Techniques 1
Exam 1: What Is Statistics46 Questions
Exam 2: Graphical Descriptive Techniques 194 Questions
Exam 3: Graphical Descriptive Techniques 2156 Questions
Exam 4: Numerical Descriptive Techniques275 Questions
Exam 5: Data Collection and Sampling84 Questions
Exam 6: Probability240 Questions
Exam 7: Random Variables and Discrete Probability Distributions283 Questions
Exam 8: Continuous Probability Distributions224 Questions
Exam 9: Sampling Distributions156 Questions
Exam 10: Introduction to Estimation154 Questions
Exam 11: Introduction to Hypothesis Testing189 Questions
Exam 12: Inference About a Population153 Questions
Exam 13: Inference About Comparing Two Populations170 Questions
Exam 14: Analysis of Variance157 Questions
Exam 15: Chi-Squared Tests179 Questions
Exam 16: Simple Linear Regression and Correlation304 Questions
Exam 17: Multiple Regression160 Questions
Exam 18: Model Building148 Questions
Exam 19: Nonparametric Statistics175 Questions
Exam 20: Time-Series Analytics and Forecasting225 Questions
Exam 21: Statistical Process Control140 Questions
Exam 22: Decision Analysis123 Questions
Exam 23: Conclusion47 Questions
Select questions type
{All-Nighters Narrative} There is a relationship between whether or not a student stayed up all night before the midterm,and how well they did on the midterm.Describe this relationship using percentages.
(Essay)
4.8/5  (31)
(31)
Twenty-five voters participating in a recent election exit poll in Minnesota were asked to state their political party affiliation.Coding the data as R for Republican,D for Democrat,and I for Independent,the data collected were as follows: I,R,D,I,R,I,I,D,R,I,I,D,R,R,I,D,I,R,I,D,I,D,R,R,and I.Construct a frequency bar chart from this data.What does the bar chart tell you about the political affiliations of those in this sample?
(Essay)
4.9/5 (31)
Provide one example of ordinal data; one example of nominal data; and one example of interval data.
(Essay)
4.7/5 (29)
Using Excel,do a cross-classification table showing the relationship between the type of customer and gender.Are gender and promotional customers related? 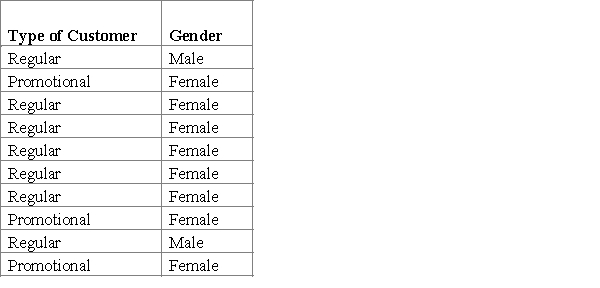
(Essay)
4.9/5 (45)
A(n)____________________ distribution lists the categories of a nominal variable and the proportion with which each occurs.
(Short Answer)
4.8/5 (27)
Business School Graduates A sample of business school graduates were asked what their major was.The results are shown in the following frequency distribution. 
-{Business School Graduates Narrative} Draw a pie chart to summarize this data.Which major was the most popular?
-{Business School Graduates Narrative} Draw a pie chart to summarize this data.Which major was the most popular?
(Essay)
4.8/5 (39)
The classification of student major (accounting,economics,management,marketing,other)is an example of a(n)
(Multiple Choice)
4.8/5 (32)
Suppose you measure the number of minutes it takes an employee to complete a task,where the maximum allowed time is 5 minutes,and each time is rounded to the nearest minute.Data from 130 employees is summarized below.Construct a frequency bar chart and a pie chart from this data.How long did it take most employees to complete the task? 
(Essay)
4.8/5 (34)
Which situation identifies when to use pie charts and/or bar charts?
(Multiple Choice)
4.8/5 (28)
Two hundred males and two hundred females were asked whether or not college baseball should have a playoff system (yes/no/undecided).Pie charts of the responses for males vs.females are shown below.Which of the following describes the relationship between gender and opinion? 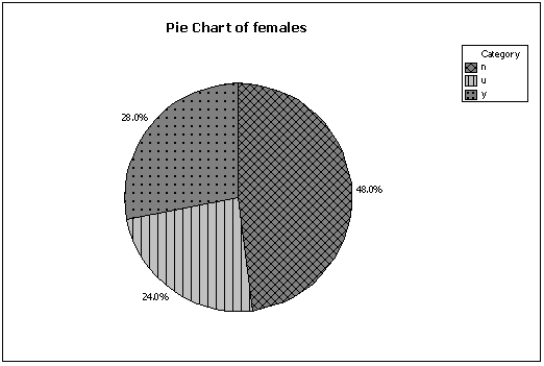
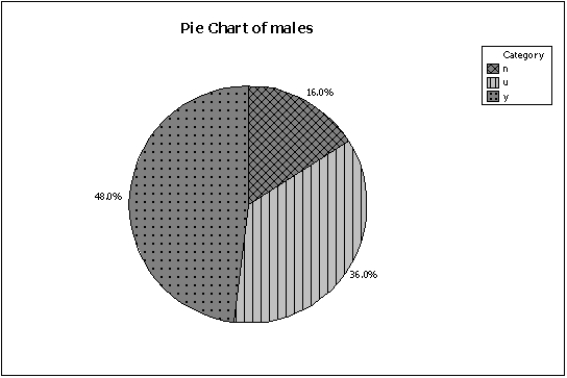
(Multiple Choice)
4.9/5 (38)
Identify the type of data for which each of the following graphs is appropriate.a.Pie chartb.Bar chart
(Short Answer)
4.8/5 (46)
Using the following cross-classification table,draw two bar charts that compare pet ownership for males vs.females.Are gender and pet ownership related? 
(Essay)
4.8/5 (36)
You can graph the relationship between two nominal variables using two ____________________ or two ____________________.
(Essay)
4.8/5 (44)
The classification of student class designation (freshman,sophomore,junior,senior)is an example of a(n)
(Multiple Choice)
4.7/5 (29)
Business School Graduates A sample of business school graduates were asked what their major was.The results are shown in the following frequency distribution.
-{Business School Graduates Narrative} Draw a pie chart of this data.Are you able to reconstruct the original data from this pie chart alone?
(Essay)
4.9/5 (36)
A relative frequency distribution lists the categories and their counts.
(True/False)
4.9/5 (35)
A cross-classification table is the same thing as two frequency distribution tables,one for each variable.
(True/False)
4.8/5 (36)
Filters
- Essay(0)
- Multiple Choice(0)
- Short Answer(0)
- True False(0)
- Matching(0)