Exam 7: Random Variables and Discrete Probability Distributions
Exam 1: What Is Statistics46 Questions
Exam 2: Graphical Descriptive Techniques 194 Questions
Exam 3: Graphical Descriptive Techniques 2156 Questions
Exam 4: Numerical Descriptive Techniques275 Questions
Exam 5: Data Collection and Sampling84 Questions
Exam 6: Probability240 Questions
Exam 7: Random Variables and Discrete Probability Distributions283 Questions
Exam 8: Continuous Probability Distributions224 Questions
Exam 9: Sampling Distributions156 Questions
Exam 10: Introduction to Estimation154 Questions
Exam 11: Introduction to Hypothesis Testing189 Questions
Exam 12: Inference About a Population153 Questions
Exam 13: Inference About Comparing Two Populations170 Questions
Exam 14: Analysis of Variance157 Questions
Exam 15: Chi-Squared Tests179 Questions
Exam 16: Simple Linear Regression and Correlation304 Questions
Exam 17: Multiple Regression160 Questions
Exam 18: Model Building148 Questions
Exam 19: Nonparametric Statistics175 Questions
Exam 20: Time-Series Analytics and Forecasting225 Questions
Exam 21: Statistical Process Control140 Questions
Exam 22: Decision Analysis123 Questions
Exam 23: Conclusion47 Questions
Select questions type
Car Sales
The joint probability distribution of variables X and Y is shown in the table below.Rebecca and Rachel are car salespeople.Let X denote the number of cars that Rebecca will sell in a month,and let Y denote the number of cars Rachel will sell in a month. 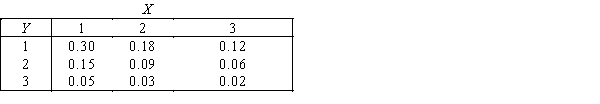
-{Car Sales Narrative} Verify that E(X + Y)= E(X)+ E(Y).
-{Car Sales Narrative} Verify that E(X + Y)= E(X)+ E(Y).
(Short Answer)
5.0/5  (25)
(25)
Montana Highways
A recent survey in Montana revealed that 60% of the vehicles traveling on highways,where speed limits are posted at 70 miles per hour,were exceeding the limit.Suppose you randomly record the speeds of ten vehicles traveling on US 131 where the speed limit is 70 miles per hour.Let X denote the number of vehicles that were exceeding the limit.
-{Montana Highways Narrative} Find the expected number of vehicles that are traveling on Montana highways and exceeding the speed limit.
(Short Answer)
4.7/5 (33)
A Poisson random variable is a(n)____________________ random variable.
(Short Answer)
4.8/5 (36)
The probability of a success in a binomial experiment is denoted by ____________________.
(Short Answer)
4.8/5 (33)
A table,formula,or graph that shows all possible values a random variable can assume,together with their associated probabilities,is called a(n):
(Multiple Choice)
4.9/5 (34)
The number of female customers out of a random sample of 100 customers arriving at a department store has a binomial distribution.
(True/False)
4.9/5 (26)
Which of the following cannot have a Poisson distribution?
(Multiple Choice)
4.7/5 (37)
An auto insurance company evaluates many numerical variables about a person before deciding on an appropriate rate for automobile insurance.A person's age is an example of a(n)____________________ random variable.
(Short Answer)
4.9/5 (31)
Determine which of the following are not valid probability distributions,and explain why not. 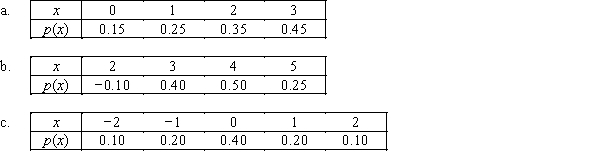
(Essay)
4.8/5 (29)
If X and Y are two variables with E(XY)= 10.56,E(X)= 4.22,and E(Y)= 5.34,then COV(X,Y)= 1.0.
(True/False)
4.8/5 (33)
Golfing Store
The joint probability distribution of variables X and Y is shown in the table below,where X is the number of drivers and Y is the number of putters sold daily in a small golfing store. 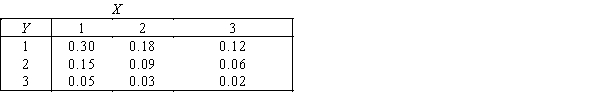
-{Golfing Store Narrative} Are X and Y independent? Explain.
-{Golfing Store Narrative} Are X and Y independent? Explain.
(Essay)
4.8/5 (28)
Car Sales
The joint probability distribution of variables X and Y is shown in the table below.Rebecca and Rachel are car salespeople.Let X denote the number of cars that Rebecca will sell in a month,and let Y denote the number of cars Rachel will sell in a month.
-{Car Sales Narrative} Verify that V(X + Y)= V(X)+ V(Y).Did you expect this result? Why?
(Essay)
4.9/5 (36)
The following information regarding a portfolio of two stocks are given: w1 = .65,w2 = .35,E(R1)= .12,and E(R2)= .14.Which of the following regarding the portfolio expected return,E(Rp),is correct?
(Multiple Choice)
4.8/5 (27)
Sports Fans
Suppose that past history shows that 5% of college students are sports fans.A sample of 10 students is to be selected.
-{Sports Fans Narrative} Find the probability that more than 1 student is a sports fan.
(Short Answer)
5.0/5 (36)
Sports Fans
Suppose that past history shows that 5% of college students are sports fans.A sample of 10 students is to be selected.
-{Sports Fans Narrative} Find the probability that at least 1 student is a sports fan.
(Short Answer)
4.9/5 (32)
A Poisson random variable is the number of successes that occur in a period of ____________________ or an interval of ____________________ in a Poisson experiment.
(Short Answer)
4.8/5 (31)
Blackjack The probability distribution of a random variable X is shown below,where X represents the amount of money (in $1,000s)gained or lost in a particular game of Blackjack. 
-{Blackjack Narrative} Find the following values and indicate their units.
a.E(X)
b.V(X)
c.Standard deviation of X
-{Blackjack Narrative} Find the following values and indicate their units.
a.E(X)
b.V(X)
c.Standard deviation of X
(Essay)
4.8/5 (31)
Golfing Store
The joint probability distribution of variables X and Y is shown in the table below,where X is the number of drivers and Y is the number of putters sold daily in a small golfing store.
-{Golfing Store Narrative} Calculate COV(X,Y).Did you expect this answer? Why?
(Essay)
4.9/5 (37)
The number of customers arriving at a department store in a 5-minute period has a binomial distribution.
(True/False)
4.9/5 (33)
Elizabeth's Portfolio
Elizabeth has decided to form a portfolio by putting 30% of her money into stock 1 and 70% into stock 2.She assumes that the expected returns will be 10% and 18%,respectively,and that the standard deviations will be 15% and 24%,respectively.
-{Elizabeth's Portfolio Narrative} Compute the standard deviation of the returns on the portfolio assuming that the coefficient of correlation is 0.5.
(Essay)
4.9/5 (40)
Filters
- Essay(0)
- Multiple Choice(0)
- Short Answer(0)
- True False(0)
- Matching(0)