Exam 13: Inference About Comparing Two Populations
Exam 1: What Is Statistics46 Questions
Exam 2: Graphical Descriptive Techniques 194 Questions
Exam 3: Graphical Descriptive Techniques 2156 Questions
Exam 4: Numerical Descriptive Techniques275 Questions
Exam 5: Data Collection and Sampling84 Questions
Exam 6: Probability240 Questions
Exam 7: Random Variables and Discrete Probability Distributions283 Questions
Exam 8: Continuous Probability Distributions224 Questions
Exam 9: Sampling Distributions156 Questions
Exam 10: Introduction to Estimation154 Questions
Exam 11: Introduction to Hypothesis Testing189 Questions
Exam 12: Inference About a Population153 Questions
Exam 13: Inference About Comparing Two Populations170 Questions
Exam 14: Analysis of Variance157 Questions
Exam 15: Chi-Squared Tests179 Questions
Exam 16: Simple Linear Regression and Correlation304 Questions
Exam 17: Multiple Regression160 Questions
Exam 18: Model Building148 Questions
Exam 19: Nonparametric Statistics175 Questions
Exam 20: Time-Series Analytics and Forecasting225 Questions
Exam 21: Statistical Process Control140 Questions
Exam 22: Decision Analysis123 Questions
Exam 23: Conclusion47 Questions
Select questions type
Two measurements from the same individuals is an example of data collected from a matched pairs experiment.
(True/False)
4.8/5  (30)
(30)
The difference in two sample proportions is a(n)____________________ estimator of the difference in their respective population proportions.
(Short Answer)
4.8/5 (36)
Antioxidants
A food processor wants to compare two antioxidants for their effects on retarding spoilage.Suppose 16 cuts of fresh meat are treated with antioxidant A and 16 are treated with antioxidant B,and the number of hours until spoilage begins is recorded for each of the 32 cuts of meat.The results are summarized in the table below 
-{Antioxidants Narrative} Explain how to use the 95% confidence interval for testing the equality of the two population variances at the 5% level.
-{Antioxidants Narrative} Explain how to use the 95% confidence interval for testing the equality of the two population variances at the 5% level.
(Essay)
4.7/5 (29)
Profit Margin
An investor is considering two types of investment.She is quite satisfied that the expected profit margin on Investment 1 is higher than the expected profit margin on Investment 2.However,she is quite concerned that the risk associated with Investment 1 is higher than that of Investment 2.To help make her decision,she randomly selects seven monthly profit margins on investment 1 and ten monthly profit margins on investment 2.She finds that the sample variances of Investments 1 and 2 are 225 and 118,respectively.
-{Profit Margin Narrative} Can she infer at the 5% significance level that the population variance of investment 1 exceeds that of investment 2?
(Essay)
4.8/5 (34)
Aptitude Test Scores
Two random samples of 40 students were drawn independently from two populations of students.Assume their aptitude tests are normally distributed (total points = 100).The following statistics regarding their scores in an aptitude test were obtained: 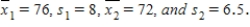 .
-{Aptitude Test Scores Narrative} Test at the 5% significance level to determine whether we can infer that the two population means differ.
.
-{Aptitude Test Scores Narrative} Test at the 5% significance level to determine whether we can infer that the two population means differ.
(Essay)
4.9/5 (29)
Two independent samples of sizes 40 and 50 are randomly selected from two populations to test the difference between the population means  .Assume the population variances are known.The sampling distribution of the sample mean difference
  is:
is:
(Multiple Choice)
4.9/5 (34)
The unequal-variances test statistic of  has an approximate ____________________ distribution with
 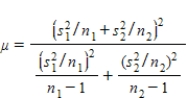 degrees of freedom.
(Short Answer)
4.9/5 (31)
For testing the difference between two population proportions,the pooled proportion estimate is found by taking:
(Multiple Choice)
4.7/5 (40)
The F-test used for testing the difference in 2 population variances is always a one-tailed test.
(True/False)
4.7/5 (33)
A test is being conducted to test the difference between two population means using data that are gathered from a matched pairs experiment.If the paired differences are normal,then the distribution used for testing is the:
(Multiple Choice)
4.8/5 (41)
Two independent samples of sizes 20 and 30 are randomly selected from two normally distributed populations.Assume that the population variances are unknown but equal.In order to test the difference between the population means,  ,the sampling distribution of the sample mean difference,
  ,is:
,is:
(Multiple Choice)
4.8/5 (31)
A calculus professor wanted to test whether the grades on calculus test were the same for upper and lower classmen.The professor took a random sample of size 12 from each group.For this situation,the professor should use a matched pairs t-test.
(True/False)
4.9/5 (33)
The variance of the difference in sample proportions equals the difference of their population variances.
(True/False)
4.8/5 (40)
When the necessary conditions are met,a two-tail test is being conducted at α = .01 to test  .The two sample variances are
  and
and  ,and the sample sizes are n1 = 36and n2 = 36.The calculated value of the p-value for the F test is 0.5926.
(True/False)
4.8/5 (36)
A political analyst in Iowa surveys a random sample of registered Republicans and compares the results with those obtained from a random sample of registered Democrats .This would be an example of two independent samples.
(True/False)
4.9/5 (33)
Mass Production Line
A quality control examiner keeps a tally sheet of the number of acceptable and unacceptable products that come off two different production lines.The completed sheet is shown below. 
-{Mass Production Line Narrative} What is the p-value of the test? Explain how to use it for testing the hypotheses.
-{Mass Production Line Narrative} What is the p-value of the test? Explain how to use it for testing the hypotheses.
(Essay)
4.8/5 (36)
Two measurements from the same individuals is an example of data collected from a(n)____________________ experiment.
(Short Answer)
4.8/5 (34)
In constructing a confidence interval estimate for the difference between two population proportions,we pool the population proportions when the populations are normally distributed.
(True/False)
4.9/5 (36)
Filters
- Essay(0)
- Multiple Choice(0)
- Short Answer(0)
- True False(0)
- Matching(0)