Exam 13: Inference About Comparing Two Populations
Exam 1: What Is Statistics46 Questions
Exam 2: Graphical Descriptive Techniques 194 Questions
Exam 3: Graphical Descriptive Techniques 2156 Questions
Exam 4: Numerical Descriptive Techniques275 Questions
Exam 5: Data Collection and Sampling84 Questions
Exam 6: Probability240 Questions
Exam 7: Random Variables and Discrete Probability Distributions283 Questions
Exam 8: Continuous Probability Distributions224 Questions
Exam 9: Sampling Distributions156 Questions
Exam 10: Introduction to Estimation154 Questions
Exam 11: Introduction to Hypothesis Testing189 Questions
Exam 12: Inference About a Population153 Questions
Exam 13: Inference About Comparing Two Populations170 Questions
Exam 14: Analysis of Variance157 Questions
Exam 15: Chi-Squared Tests179 Questions
Exam 16: Simple Linear Regression and Correlation304 Questions
Exam 17: Multiple Regression160 Questions
Exam 18: Model Building148 Questions
Exam 19: Nonparametric Statistics175 Questions
Exam 20: Time-Series Analytics and Forecasting225 Questions
Exam 21: Statistical Process Control140 Questions
Exam 22: Decision Analysis123 Questions
Exam 23: Conclusion47 Questions
Select questions type
Clinic Waiting Time
In a random sample of 20 patients who visited a clinic at Medical Center 1,a researcher found that the variance of the waiting time (in minutes)was 128.0.In a random sample of 15 patients in the clinic of Medical Center 2,the researcher found the variance to be 178.8.
-{Clinic Waiting Time Narrative} Can we infer at the 5% level of significance that the population variances differ?
(Essay)
4.9/5  (35)
(35)
Clothing Expenditures
A marketing consultant was in the process of studying the perceptions of married couples concerning their monthly clothing expenditures.He believed that the husband's perception would be higher than the wife's.To judge his belief,he takes a random sample of ten married couples and asks each spouse to estimate the family clothing expenditure (in dollars)during the previous month.The data are shown below. 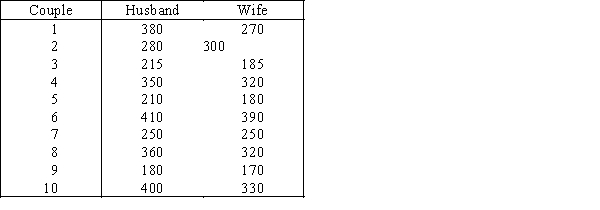
-{Clothing Expenditures Narrative} Briefly describe what the interval estimate tells you.
-{Clothing Expenditures Narrative} Briefly describe what the interval estimate tells you.
(Essay)
4.8/5 (36)
When the data from two populations are ____________________ the parameter to be tested and estimated is the difference between the two population proportions.
(Short Answer)
4.9/5 (45)
In constructing a confidence interval estimate for the difference between two population proportions,we:
(Multiple Choice)
4.9/5 (35)
The test for the equality of two population variances assumes that each of the two populations is normally distributed.
(True/False)
4.9/5 (39)
Starting Salary
In testing the hypotheses  two random samples from two populations of college of business graduates majoring in global marketing and international business produced the following statistics regarding their starting salaries (in $1000s):
  (Assume the salaries have normal distributions.)
-{Starting Salary Narrative} Estimate with 95% confidence the difference between the two population means.
(Assume the salaries have normal distributions.)
-{Starting Salary Narrative} Estimate with 95% confidence the difference between the two population means.
(Essay)
4.8/5 (38)
The pooled variance estimator is the ____________________ average of the two sample variances.
(Short Answer)
4.8/5 (31)
Senatorial Election
A political poll immediately prior to a senatorial election reveals that 145 out of 250 male voters and 105 out of 200 female voters intend to vote for the Democrat candidate.
-{Senatorial Election Narrative} Explain how to use the interval estimate to test the hypotheses.
(Essay)
4.9/5 (35)
Senatorial Election
A political poll immediately prior to a senatorial election reveals that 145 out of 250 male voters and 105 out of 200 female voters intend to vote for the Democrat candidate.
-{Senatorial Election Narrative} Estimate with 95% confidence the difference in the proportion of male and female voters who intend to vote for the Democrat candidate.
(Essay)
4.8/5 (32)
Two independent samples of sizes 25 and 35 are randomly selected from two normal populations with equal variances (assumed to be unknown).In order to test the difference between the population means,the test statistic is:
(Multiple Choice)
4.9/5 (38)
The service manager of a car dealer wants to determine if owners of new cars (two years old or less)tune up their cars more frequently than owners of older cars (more than two years old).From his records he takes a random sample of ten new cars and ten older cars and determines the number of times the cars were tuned up in the last 12 months.The data follow.Do these data allow the service station owner to infer at the 10% significance level that new car owners tune up their cars more frequently than older car owners? 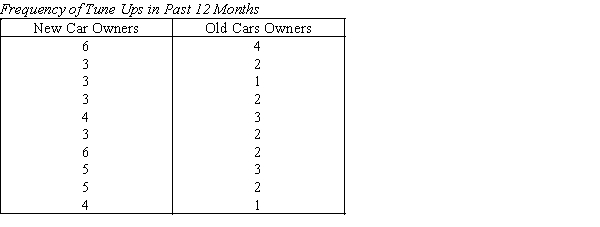
(Essay)
4.8/5 (33)
Additives
A food processor wants to compare two additives for their effects on retarding spoilage.Suppose 16 cuts of fresh meat are treated with additive A and 16 are treated with additive B,and the number of hours until spoilage begins is recorded for each of the 32 cuts of meat.The results are summarized in the table below 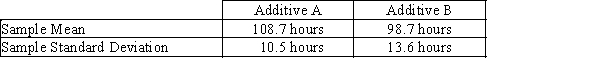
-{Additives Narrative} Assume population variances are equal.Calculate the pooled variance and the value of the test statistic.
-{Additives Narrative} Assume population variances are equal.Calculate the pooled variance and the value of the test statistic.
(Essay)
4.9/5 (32)
When we test for differences between the means of two independent populations,we can only use a two-tailed test.
(True/False)
4.8/5 (36)
A behaviorist has performed the following experiment.For each of 10 sets of identical twins who were born 30 years ago,he recorded their annual incomes,according to which twin was born first.The results (in $1,000s)are shown below.Can he infer at 5% significance level that there is a difference in income between the twins? 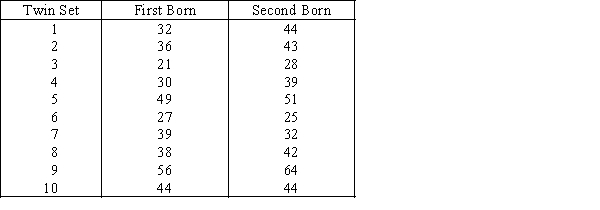
(Essay)
5.0/5 (37)
In testing the difference between two population means using two independent samples,we use the pooled variance in estimating the standard error of the sampling distribution of the sample mean difference  if the populations are normal with equal variances.
(True/False)
4.7/5 (35)
For testing the difference between two population proportions,the pooled proportion estimate should be used to compute the value of the test statistic when the:
(Multiple Choice)
4.8/5 (32)
The quantity  is called the pooled variance estimate of the common variance of two unknown but equal population variances.It is the weighted average of the two sample variances,where the weights represent the:
(Multiple Choice)
4.8/5 (34)
If you are testing to see if a weight loss program is working,and you subtract the weights before − after for a group of 10 people,the alternative hypothesis is that the mean difference is ____________________ 0.
(Short Answer)
4.9/5 (37)
Filters
- Essay(0)
- Multiple Choice(0)
- Short Answer(0)
- True False(0)
- Matching(0)